This quarter’s update introduces the concept of Sequence of Return Risk and how this under-appreciated risk especially relevant in today’s market environment.
If MCS clients’ investments were treated as one large portfolio including their cash, on average clients gained on 3.28%1 through September 30, 2017, after fees. The range of individual client returns was from 0.85% to 10.26%. For comparison purposes, the S&P 500 Total Return Stock index earned 14.24%, and the Barclays Aggregate Bond Index was up 3.14%.
Clients who outperformed had higher equity balances. Clients who underperformed were new clients with funds recently invested in short term bonds, those who had lower equity allocations, or clients who held low basis stock that underperformed this year.
Befuddled With Lots of Company
“There’s nothing here to suggest why the core (inflation) number was as weak as it is, but that’s just consistent with the trends that we’ve seen,” said Phil Orlando, chief equity strategist at Federated Investors Inc. “Inflation has been befuddling everyone for a really long time.” Source: Bloomberg 10/13/17 Count me among the befuddled.
The low return / risk averse strategy that I am pursuing on your behalf is predicated on lower unemployment / higher inflation raising long term interest rates. This would negatively impact bond, stock and real estate prices but has yet to materialize. It’s possible that stock prices will continue to rise despite rising interest rates. If company earnings gains out-pace rising interest rates, stocks prices may grind higher. Stock prices fall when interest rates or inflation go up faster or higher than expected.
I continue to believe this is a high risk environment. That does not mean something bad will happen soon, but it does mean investments remain vulnerable to an ugly period of declining asset prices. Today asset prices reflect the following four assumptions far into the future:
Modest yet steady economic growth
Low inflation
Low interest rates
Political stability
I am further mindful that most of my clients are nearing, at, or past their peak asset accumulation years. Big mistakes at this life stage usually offer little or no second chance of recovery to former levels of wealth. We saw this play out during the DOT Com and Real Estate Bubbles when many near retirees became rich enough to retire by pursuing a high risk strategy (it never looks high risk when you’re making money). The retired then saw their portfolio shredded to the point of the retiree needing to downsize / go back to work… assuming there was a job to be had. And then there’s the emotional toll of never again having what you once had. This toll is heaviest on those whose self-image is most strongly aligned with their monetary success. Others adjust to such an outcome, concluding that they are ok with having less.
Once again, I will offer to those clients who feel they should be pursuing higher returns by taking more risk the opportunity to do so. Let’s have a conversation about your expectations, how that will take place in your portfolio and the potential outcomes. It’s not hard to change the portfolio risk / return.
Managing Risk to Increase Returns
In keeping with our above tagline, below I introduce you to Sequence of Return Risk (SRR) – a significant type of investment risk that you may be unfamiliar with. SRR describes how an investor’s portfolio can be seriously damaged depending upon the order in which investment returns occur each year when the investor must withdraw money to live on. This risk exists even if the projected return is met. It’s like driving to a city with multiple roads of equal length to choose from. All roads lead to the city but some roads are so rough, your car will breakdown and you’ll never arrive.
SRR applies most to clients who are living off their portfolio (savings) or are within 5 years of retirement. Sequence of return risk considers the order (sequence) of annual returns that make up your long term return and the impact of the annual client withdrawals on the value of your portfolio.
I have long considered and attempted to mitigate Sequence of Return Risk. Given the high price of assets (stocks, bonds, real estate) today, and low long term return forecasts for stocks and bonds, this is a risk that clients should understand.
BlackRock, an asset management firm, has done a nice job of illustrating the SRR concept (despite their unrealistic 7% net return assumption). I encourage you to spend a little time looking at the tables that follow.
Among what stands out for me is the following:
The ‘poor returns’ are a mere -4% and -7% while the good returns are double digit i.e. 12%, 15%, 22%. Nothing like the disastrous returns that many investors actually experienced from 2000 to 2010.
Table 2 returns are the same for Mrs. Doe & Mr. White, but in reverse order.
Annual return (7% or $70,000) is greater than the distribution rate (6% or 60,000) for the first 5 years. Today, the distribution rate for many investors is likely to be larger than the annual return.
No taxes are assumed.
To make it more complicated, our experience is that, unlike the illustration, clients in retirement do not simply withdrawal a set amount adjusted for inflation – not by a long shot. Clients’ withdrawals can vary significantly from year to year. In effect, client circumstances may create a sequence of withdrawals risk on top of the sequence of return risk.
What if you are not withdrawing any money and don’t plan to?
You have more choices about the amount of risk you can take in pursuit of higher returns. There is no right or wrong answer about how you should invest if you don’t think you’ll need the money to live on. Equally valid responses include:
I want to earn more. I’m not bothered if there are big fluctuations in the value of my portfolio. This money is going to my heirs.
A big stable portfolio is what gives me my sense of security. I just want it to grow without having to worry about big fluctuations in value.
I’d like to carve off part of my portfolio for higher risk /return investing but not so much that it could jeopardize my security. I’d like to discuss how much makes sense.
I spent a lifetime accumulating this money through my business efforts and don’t trust the stock market. I just want this money preserved for future generations and their business interests.
Everything looks expensive, I’ll wait for better opportunities. The real money is made buying when others are fearful and prices are cheap, just like Warren Buffet says.
You can’t time the market so I’ll just get in and ignore the fluctuations. This money has a 25 year plus time horizon. I’ll look at a statement maybe once a year.
Bottom line
In the past, sequence of return risk could be mitigated by allocating a significant portion of client money to longer term bonds. The steady income significantly reduced both portfolio value fluctuations and the amount of principal spent when financial markets do poorly. For those not taking distributions, the relative safety of bond returns made forecasting the future value of a portfolio more reliable.
Today, I believe that long term bond returns do not compensate investors for the risks that lay ahead. Ditto for stocks. Therefore, I am investing conservatively and waiting for circumstances to offer better risk / reward opportunities.
1 MCS Family Wealth Advisors (MCS) consolidated client returns are dollar-weighted, net of investment management fees ufees unless stated otherwise, include reinvestment of dividends and capital gains and represent all clients fully discretionary accounts under management for at least one full month in 2017. Individual client returns represent client discretionary accounts under management for the entire period – starting on 12/31/2016 and ending on 09/30/2017. These accounts represent 96% of MCS’s discretionary fee-paying assets under management as of 09/30/2017 and were invested primarily in US stocks and bonds (16% of client assets on 09/30/2017 were invested in tax-exempt municipal bonds). The Stock Index values are based on the S&P 500 Total Return Index, which measures the large-capitalization US equity market. The Bond Index values are based on the Barclays Capital US Aggregate Bond Index, which measures the US investment-grade bond market. Index values are for comparison purposes only. The report is for information purposes only and does not consider the specific investment objective, financial situation, or particular needs of any recipient, nor is it to be construed as an offer to sell or solicit investment management or any other services. Past performance is not indicative of future results.
UPDATE
The MCS Card You Received
Recently we sent cards to MCS clients who have been with us for 2-3 years or more. Each card indicated how much money the client had made since our relationship started.
Why did we do this?
The idea for this special mailing was the result of a simple client question: ‘Have I made any money?’ The answer to that client’s question was: “Yes, over $1 million dollars.” This raised a new question; “Why was the client unaware of this?”
While we report how much money clients have earned every quarter*, we understand that our reports have a lot of information to absorb. Clients differ in both their preferences for detail and interest in pouring over lots of numbers. The note card offered a simple / less dry approach to reporting what matters.
“Shocking” is how one client described the card. I inquired whether that was a good shock or bad shock – he said it was a good shock but still professed some disbelief that the amount could be so much. He used an analogy suggesting it was like children growing up. If you see children every day you don’t notice the change, but if you see them every few years the change is significant.
“My portfolio hasn’t gone anywhere,” another client commented. What was happening?
The client was focusing on the total portfolio value and, indeed, it hadn’t progressed much over a three-year period. While the client was making money, the portfolio didn’t grow because the client was spending the portfolio earnings.
For some clients, the amount they made exceeded their current portfolio value. This means that all the money that the client contributed and a portion of the earnings has been spent. The money was saved to be spent in the future, and that’s what is happening.
Phase II
Each quarterly client report contains a graph showing the net cumulative investment line, portfolio value and portfolio gain. Our next step is to send out sample report pages with labels describing how to interpret them.
We would welcome your input on any of the above.
* The total amount client investments have earned appears after the newsletter section of your MCS quarterly portfolio report. It is illustrated in a graph on page 3 (Portfolio Value vs Cumulative Net Investment) and in a table on page 4 (Performance Summary).
Categories
2017 Third Quarter Newsletter
Sequence of Return Risk
This quarter’s update introduces the concept of Sequence of Return Risk and how this under-appreciated risk especially relevant in today’s market environment.
If MCS clients’ investments were treated as one large portfolio including their cash, on average clients gained on 3.28%1 through September 30, 2017, after fees. The range of individual client returns was from 0.85% to 10.26%. For comparison purposes, the S&P 500 Total Return Stock index earned 14.24%, and the Barclays Aggregate Bond Index was up 3.14%.
Clients who outperformed had higher equity balances. Clients who underperformed were new clients with funds recently invested in short term bonds, those who had lower equity allocations, or clients who held low basis stock that underperformed this year.
Befuddled With Lots of Company
“There’s nothing here to suggest why the core (inflation) number was as weak as it is, but that’s just consistent with the trends that we’ve seen,” said Phil Orlando, chief equity strategist at Federated Investors Inc. “Inflation has been befuddling everyone for a really long time.” Source: Bloomberg 10/13/17
Count me among the befuddled.
The low return / risk averse strategy that I am pursuing on your behalf is predicated on lower unemployment / higher inflation raising long term interest rates. This would negatively impact bond, stock and real estate prices but has yet to materialize. It’s possible that stock prices will continue to rise despite rising interest rates. If company earnings gains out-pace rising interest rates, stocks prices may grind higher. Stock prices fall when interest rates or inflation go up faster or higher than expected.
I continue to believe this is a high risk environment. That does not mean something bad will happen soon, but it does mean investments remain vulnerable to an ugly period of declining asset prices. Today asset prices reflect the following four assumptions far into the future:
I am further mindful that most of my clients are nearing, at, or past their peak asset accumulation years. Big mistakes at this life stage usually offer little or no second chance of recovery to former levels of wealth. We saw this play out during the DOT Com and Real Estate Bubbles when many near retirees became rich enough to retire by pursuing a high risk strategy (it never looks high risk when you’re making money). The retired then saw their portfolio shredded to the point of the retiree needing to downsize / go back to work… assuming there was a job to be had. And then there’s the emotional toll of never again having what you once had. This toll is heaviest on those whose self-image is most strongly aligned with their monetary success. Others adjust to such an outcome, concluding that they are ok with having less.
Once again, I will offer to those clients who feel they should be pursuing higher returns by taking more risk the opportunity to do so. Let’s have a conversation about your expectations, how that will take place in your portfolio and the potential outcomes. It’s not hard to change the portfolio risk / return.
Managing Risk to Increase Returns
In keeping with our above tagline, below I introduce you to Sequence of Return Risk (SRR) – a significant type of investment risk that you may be unfamiliar with. SRR describes how an investor’s portfolio can be seriously damaged depending upon the order in which investment returns occur each year when the investor must withdraw money to live on. This risk exists even if the projected return is met. It’s like driving to a city with multiple roads of equal length to choose from. All roads lead to the city but some roads are so rough, your car will breakdown and you’ll never arrive.
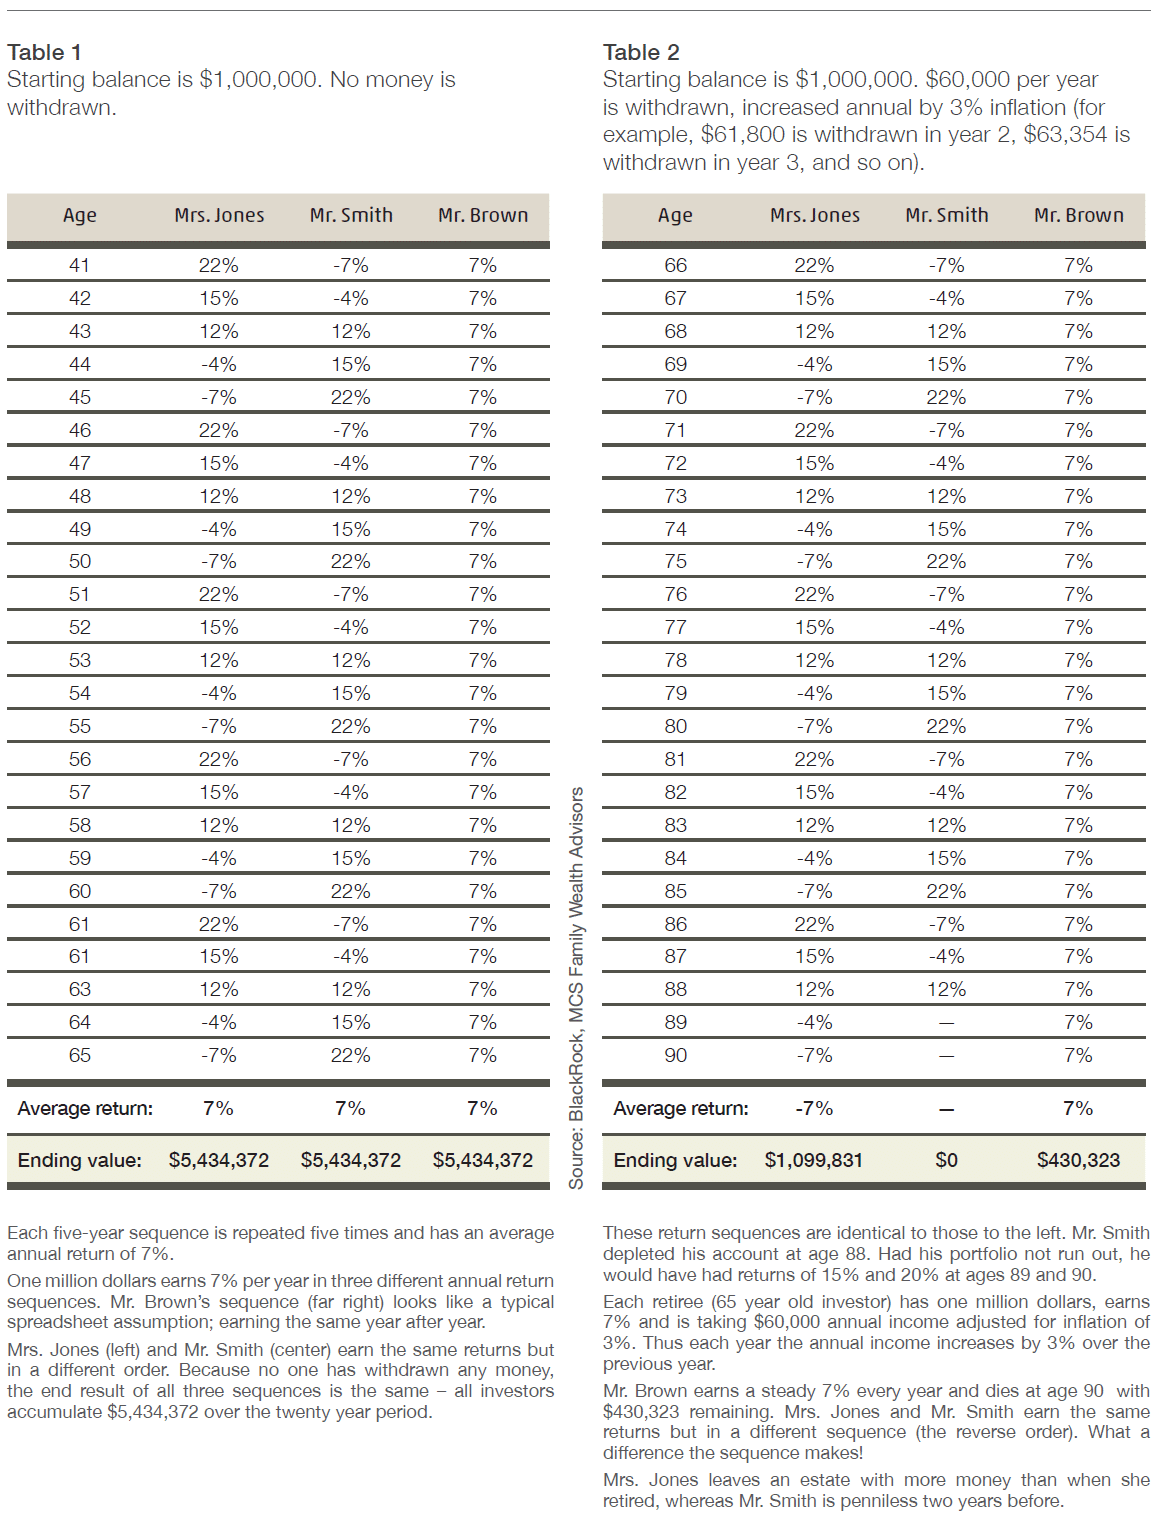
SRR applies most to clients who are living off their portfolio (savings) or are within 5 years of retirement. Sequence of return risk considers the order (sequence) of annual returns that make up your long term return and the impact of the annual client withdrawals on the value of your portfolio.
I have long considered and attempted to mitigate Sequence of Return Risk. Given the high price of assets (stocks, bonds, real estate) today, and low long term return forecasts for stocks and bonds, this is a risk that clients should understand.
BlackRock, an asset management firm, has done a nice job of illustrating the SRR concept (despite their unrealistic 7% net return assumption). I encourage you to spend a little time looking at the tables that follow.
Among what stands out for me is the following:
To make it more complicated, our experience is that, unlike the illustration, clients in retirement do not simply withdrawal a set amount adjusted for inflation – not by a long shot. Clients’ withdrawals can vary significantly from year to year. In effect, client circumstances may create a sequence of withdrawals risk on top of the sequence of return risk.
What if you are not withdrawing any money and don’t plan to?
You have more choices about the amount of risk you can take in pursuit of higher returns. There is no right or wrong answer about how you should invest if you don’t think you’ll need the money to live on.
Equally valid responses include:
Bottom line
In the past, sequence of return risk could be mitigated by allocating a significant portion of client money to longer term bonds. The steady income significantly reduced both portfolio value fluctuations and the amount of principal spent when financial markets do poorly. For those not taking distributions, the relative safety of bond returns made forecasting the future value of a portfolio more reliable.
Today, I believe that long term bond returns do not compensate investors for the risks that lay ahead. Ditto for stocks. Therefore, I am investing conservatively and waiting for circumstances to offer better risk / reward opportunities.
UPDATE
The MCS Card You Received
Recently we sent cards to MCS clients who have been with us for 2-3 years or more. Each card indicated how much money the client had made since our relationship started.
Why did we do this?
The idea for this special mailing was the result of a simple client question: ‘Have I made any money?’ The answer to that client’s question was: “Yes, over $1 million dollars.”
This raised a new question; “Why was the client unaware of this?”
While we report how much money clients have earned every quarter*, we understand that our reports have a lot of information to absorb. Clients differ in both their preferences for detail and interest in pouring over lots of numbers. The note card offered a simple / less dry approach to reporting what matters.
“Shocking” is how one client described the card. I inquired whether that was a good shock or bad shock – he said it was a good shock but still professed some disbelief that the amount could be so much. He used an analogy suggesting it was like children growing up. If you see children every day you don’t notice the change, but if you see them every few years the change is significant.
“My portfolio hasn’t gone anywhere,” another client commented. What was happening?
The client was focusing on the total portfolio value and, indeed, it hadn’t progressed much over a three-year period. While the client was making money, the portfolio didn’t grow because the client was spending the portfolio earnings.
For some clients, the amount they made exceeded their current portfolio value. This means that all the money that the client contributed and a portion of the earnings has been spent. The money was saved to be spent in the future, and that’s what is happening.
Phase II
Each quarterly client report contains a graph showing the net cumulative investment line, portfolio value and portfolio gain. Our next step is to send out sample report pages with labels describing how to interpret them.
We would welcome your input on any of the above.