The markets treaded water in the first half. Trade war rhetoric, a deceleration in non-US global economic growth and fears of a yield curve inversion1 stalled investor’s enthusiasm despite the robust US economy.
Although inflation concerns were in the mix too, the bond and stock markets continued to behave as if inflation will not be an issue. This has been reflected in the collapse of real yields (Interest rate minus inflation rate = real yield) which I covered in the first quarter newsletter. In this newsletter, I will discuss inflation, threats to the bond and stock markets from rising interest rates, and an announcement about a new MCS office in Bend, Oregon.
Performance Update2
If MCS clients’ investments were treated as one large portfolio including their cash, on average clients gained 0.96% in the first half of 2018, after fees. For comparison purposes, the S&P 500 Total Return Stock index gained 2.65%, and the Barclays Aggregate Bond Index lost 1.62%. The range of individual client returns was from a loss of 0.93 % to a gain of 5.22%. Clients with the highest returns had a higher percentage of their portfolio invested in low-basis stocks that outperformed. Clients who underperformed had low-basis stock that underperformed or were invested more heavily in international markets.
Inflation
A July 2018 PIMCO report echoes MCS inflation concerns
PIMCO, the world’s largest bond manager, covered many of the inflation risks that I have been writing about over the past 15 months in their July 2018 Viewpoint publication. While stating it is not PIMCO’s baseline outlook, the article concludes with the observation that the markets are not prepared for this risk: “Although our baseline inflation outlook does not envision a rapid acceleration over the secular horizon, we see greater inflation risk than in recent years – and we believe many investors may be underestimating the possibility of a longer-term inflation surprise. Such longer-term risk could be very disruptive; … it would imply a change in correlation between major assets by depressing prices for bonds and equities at the same time. This could be another rude awakening for investors who may have assumed their portfolios were balanced.”
PIMCO Viewpoints, July 2018
The full article can be found here: http://bit.ly/2mJ9rpw
Will labor costs spark inflation?
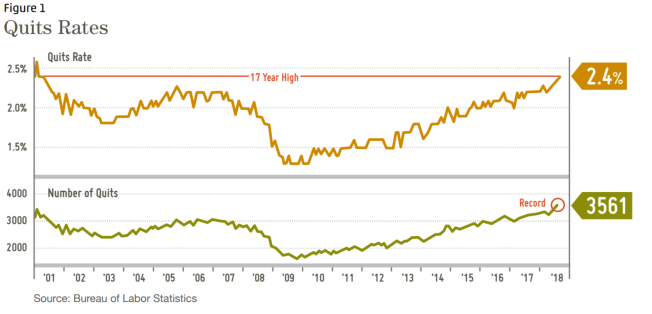
Is the economy drawing closer to a potential spike in labor costs and hence higher inflation or stagflation? Stagflation occurs when increased costs cannot be easily passed through to consumers. Rather than showing up in the consumer price index; a measure of inflation, stagflation shows up as lower profits since the increased costs are absorbed by companies instead of being passed through to consumers in the form of higher prices. Evidence that workers are becoming more emboldened to seek higher wages is reflected in the “Quits Rate,” now at a 17 year high.
This chart compares the Quits Rate to inflation.
The chart above shows how Core CPI (CPI minus food and energy) generally followed changes in the Quits Rate; as the Quits Rate went up, CPI later went up and when the Quits Rate declined, later so did CPI. Admittedly this is not a lot of data, only 18 years, but it implies a potential spike in inflation as the Quits Rate moves higher.
Do Import Tariffs Matter?
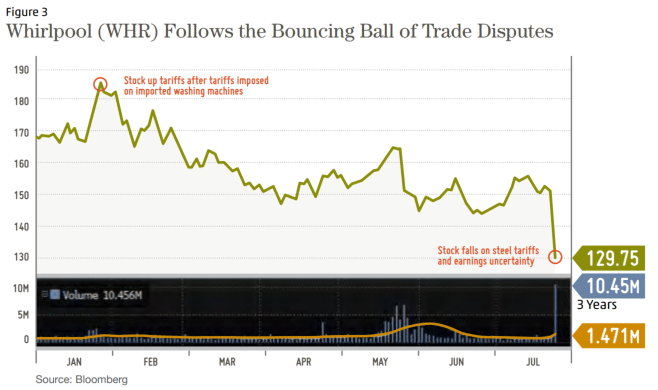
Tariffs on imported goods are another potential source of inflated prices for some items. It seems that the stock market, as measured by the S&P 500, is unperturbed by tariff threats. But it’s complicated. Whirlpool (WHR) stock increased in January when the International Trade Commission agreed with Whirlpool’s tariff request on imported washing machines. But the stock has been hard hit in July as a result of tariffs on imported steel. Consumers saw a 20% increase in washing machine prices in June.
Bottom Line
The tax cut has juiced economic growth – tax cuts would normally be done when the economy was flagging to boost it out of a recession. The federal government is running higher deficits at a time when strong profits and higher tax receipts should be reducing debt. While it feels good in the short run, we’ll see how it plays out over an entire business cycle.
Inflationary pressures continue to build. Longer term bonds are unattractive in this environment. It’s possible the stock market has more upside if inflation remains modest and earnings are strong enough to offset rising bond yields. It’s not a bet I’m comfortable making at this stage of the cycle. But, it is a bet that many investors are making.
My strategy is to continue to monitor our client stock and shrinking long term bond positions and lighten up where appropriate. Short term bonds with their increasing yields remain an excellent, albeit unexciting investment from a reward / risk standpoint. As always, if you would like your portfolio to be more reward / risk oriented (i.e. own more stock), let’s have a conversation and decide what makes sense.
Announcement
MCS to open office in Bend, Oregon!
I am excited to announce that I will be establishing an office in Bend, Oregon. We have been looking at property there for about 2 years. This change makes my wife, Debbie, very happy! (She suffers with allergies and can no longer tolerate the Willamette Valley’s extreme pollen counts.) Some of my most successful clients have continued their careers from home offices. I’m going to take a page out their playbook and apply it in Bend.
I do not anticipate the move having any impact on our services. Jeff is planning to move back to Eugene in 2020. Therefore, it looks like MCS will not have a physical presence in Eugene in 2019. Please let us know if you have any questions or concerns.
1A yield curve inversion is when short term interest rates are higher than long term rates. 2MCS Family Wealth Advisors (MCS) consolidated client returns are dollar-weighted, net of investment management fees unless stated otherwise, include reinvestment of dividends and capital gains and represent all clients with fully discretionary accounts under management for at least one full month in 2017. Individual client returns represent client discretionary accounts under management for the entire period – starting on 12/31/2016 and ending on 12/31/2017. These accounts represent 97% of MCS’s discretionary fee-paying assets under management as of 12/31/2017 and were invested primarily in US stocks and bonds (15% of client assets on 12/31/2017 were invested in tax-exempt municipal bonds). The Stock Index values are based on the S&P 500 Total Return Index, which measures the large-capitalization US equity market. The Bond Index values are based on the Barclays Capital US Aggregate Bond Index, which measures the US investment-grade bond market. Index values are for comparison purposes only. The report is for information purposes only and does not consider the specific investment objective, financial situation, or particular needs of any recipient, nor is it to be construed as an offer to sell or solicit investment management or any other services. Past performance is not indicative of future results.
Categories
2018 Second Quarter Newsletter & Outlook
The markets treaded water in the first half. Trade war rhetoric, a deceleration in non-US global economic growth and fears of a yield curve inversion1 stalled investor’s enthusiasm despite the robust US economy.
Although inflation concerns were in the mix too, the bond and stock markets continued to behave as if inflation will not be an issue. This has been reflected in the collapse of real yields (Interest rate minus inflation rate = real yield) which I covered in the first quarter newsletter. In this newsletter, I will discuss inflation, threats to the bond and stock markets from rising interest rates, and an announcement about a new MCS office in Bend, Oregon.
Performance Update2
If MCS clients’ investments were treated as one large portfolio including their cash, on average clients gained 0.96% in the first half of 2018, after fees. For comparison purposes, the S&P 500 Total Return Stock index gained 2.65%, and the Barclays Aggregate Bond Index lost 1.62%. The range of individual client returns was from a loss of 0.93 % to a gain of 5.22%. Clients with the highest returns had a higher percentage of their portfolio invested in low-basis stocks that outperformed. Clients who underperformed had low-basis stock that underperformed or were invested more heavily in international markets.
Inflation
A July 2018 PIMCO report echoes MCS inflation concerns
PIMCO, the world’s largest bond manager, covered many of the inflation risks that I have been writing about over the past 15 months in their July 2018 Viewpoint publication. While stating it is not PIMCO’s baseline outlook, the article concludes with the observation that the markets are not prepared for this risk: “Although our baseline inflation outlook does not envision a rapid acceleration over the secular horizon, we see greater inflation risk than in recent years – and we believe many investors may be underestimating the possibility of a longer-term inflation surprise. Such longer-term risk could be very disruptive; … it would imply a change in correlation between major assets by depressing prices for bonds and equities at the same time. This could be another rude awakening for investors who may have assumed their portfolios were balanced.”
PIMCO Viewpoints, July 2018
The full article can be found here: http://bit.ly/2mJ9rpw
Will labor costs spark inflation?
Is the economy drawing closer to a potential spike in labor costs and hence higher inflation or stagflation? Stagflation occurs when increased costs cannot be easily passed through to consumers. Rather than showing up in the consumer price index; a measure of inflation, stagflation shows up as lower profits since the increased costs are absorbed by companies instead of being passed through to consumers in the form of higher prices. Evidence that workers are becoming more emboldened to seek higher wages is reflected in the “Quits Rate,” now at a 17 year high.
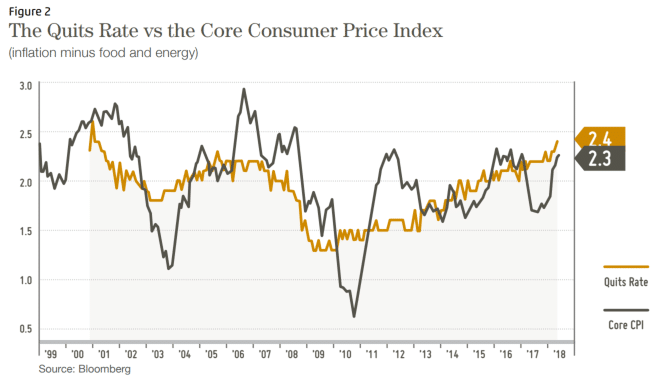
This chart compares the Quits Rate to inflation.
The chart above shows how Core CPI (CPI minus food and energy) generally followed changes in the Quits Rate; as the Quits Rate went up, CPI later went up and when the Quits Rate declined, later so did CPI. Admittedly this is not a lot of data, only 18 years, but it implies a potential spike in inflation as the Quits Rate moves higher.
Do Import Tariffs Matter?
Tariffs on imported goods are another potential source of inflated prices for some items. It seems that the stock market, as measured by the S&P 500, is unperturbed by tariff threats. But it’s complicated. Whirlpool (WHR) stock increased in January when the International Trade Commission agreed with Whirlpool’s tariff request on imported washing machines. But the stock has been hard hit in July as a result of tariffs on imported steel. Consumers saw a 20% increase in washing machine prices in June.
Bottom Line
The tax cut has juiced economic growth – tax cuts would normally be done when the economy was flagging to boost it out of a recession. The federal government is running higher deficits at a time when strong profits and higher tax receipts should be reducing debt. While it feels good in the short run, we’ll see how it plays out over an entire business cycle.
Inflationary pressures continue to build. Longer term bonds are unattractive in this environment. It’s possible the stock market has more upside if inflation remains modest and earnings are strong enough to offset rising bond yields. It’s not a bet I’m comfortable making at this stage of the cycle. But, it is a bet that many investors are making.
My strategy is to continue to monitor our client stock and shrinking long term bond positions and lighten up where appropriate. Short term bonds with their increasing yields remain an excellent, albeit unexciting investment from a reward / risk standpoint. As always, if you would like your portfolio to be more reward / risk oriented (i.e. own more stock), let’s have a conversation and decide what makes sense.
Announcement
MCS to open office in Bend, Oregon!
I am excited to announce that I will be establishing an office in Bend, Oregon. We have been looking at property there for about 2 years. This change makes my wife, Debbie, very happy! (She suffers with allergies and can no longer tolerate the Willamette Valley’s extreme pollen counts.) Some of my most successful clients have continued their careers from home offices. I’m going to take a page out their playbook and apply it in Bend.

I do not anticipate the move having any impact on our services. Jeff is planning to move back to Eugene in 2020. Therefore, it looks like MCS will not have a physical presence in Eugene in 2019. Please let us know if you have any questions or concerns.
1A yield curve inversion is when short term interest rates are higher than long term rates.
2MCS Family Wealth Advisors (MCS) consolidated client returns are dollar-weighted, net of investment management fees unless stated otherwise, include reinvestment of dividends and capital gains and represent all clients with fully discretionary accounts under management for at least one full month in 2017. Individual client returns represent client discretionary accounts under management for the entire period – starting on 12/31/2016 and ending on 12/31/2017. These accounts represent 97% of MCS’s discretionary fee-paying assets under management as of 12/31/2017 and were invested primarily in US stocks and bonds (15% of client assets on 12/31/2017 were invested in tax-exempt municipal bonds). The Stock Index values are based on the S&P 500 Total Return Index, which measures the large-capitalization US equity market. The Bond Index values are based on the Barclays Capital US Aggregate Bond Index, which measures the US investment-grade bond market. Index values are for comparison purposes only. The report is for information purposes only and does not consider the specific investment objective, financial situation, or particular needs of any recipient, nor is it to be construed as an offer to sell or solicit investment management or any other services. Past performance is not indicative of future results.