If MCS clients’ investments were treated as one large portfolio including their cash, on average clients gained 4.28% in 2017, after fees. The range of individual client returns was from 0.90% to 12.73%. For comparison purposes, the S&P 500 Total Return Stock index earned 21.83%, and the Barclays Aggregate Bond Index was up 3.54%.
Clients who outperformed had higher equity balances and a lower cash-and-short-term bond allocation due to higher cash flow needs. Clients who underperformed were new clients with funds recently invested in short term bonds, those who had lower equity allocations, or clients who held low basis stock that underperformed this year.
As 2017 closed out, article after news article described the most significant current risk to the market as a pickup of inflation and subsequent increase in interest rates.
The concerns that I began writing about in mid-2016 had finally found other voices. Here’s a sample:
“Goldman Warns Highest Valuations Since 1900 Means Pain Is Coming”
Source: Goldman Sachs, Bloomberg, 11/29/2017
“Inflation Breakout would be worse for Markets than a Depression”
Source: GMO 12/15/2017 letter to clients, Bloomberg, 12/21/2017
“What Inflation Could Mean for the Market”
Source: Barron’s, 01/01/2018
“Inflation-Is-Dead Camp Faces Big Risk as Price Pressures Bubble”
Source: Bloomberg, 01/03/2018
Prices of stocks, real estate and bonds remain vulnerable to higher interest rates. The catalyst for higher interest rates would be higher inflation.
Assuming that inflation is not dead, the speed and magnitude of inflation will determine the severity of its impact on asset prices. A slow or modest increase of inflation for a short time would do little or no damage to stock and real estate prices. A rapid – or a robust and steady – increase in inflation, on the other hand, could cause severe drops across all asset classes. The ingredients for higher inflation are the same as those driving stock prices higher; synchronized global growth, potential stimulus from tax cuts, and full employment. Economists are perplexed by the lack of inflationary pressure at this point in the business cycle and rationalize that inflation may simply be taking longer than usual to show up.
The Bullish Case for Stocks
Many clients are unnerved by the President’s behavior, seeing it as a source of significant, albeit hard to quantify, risk for both our country and the world. In the absence of a significant negative shock like a war with North Korea or discovery of information so serious that a GOP-controlled House of Representatives would support impeachment of the President, the financial markets care only about events related to future corporate profits.
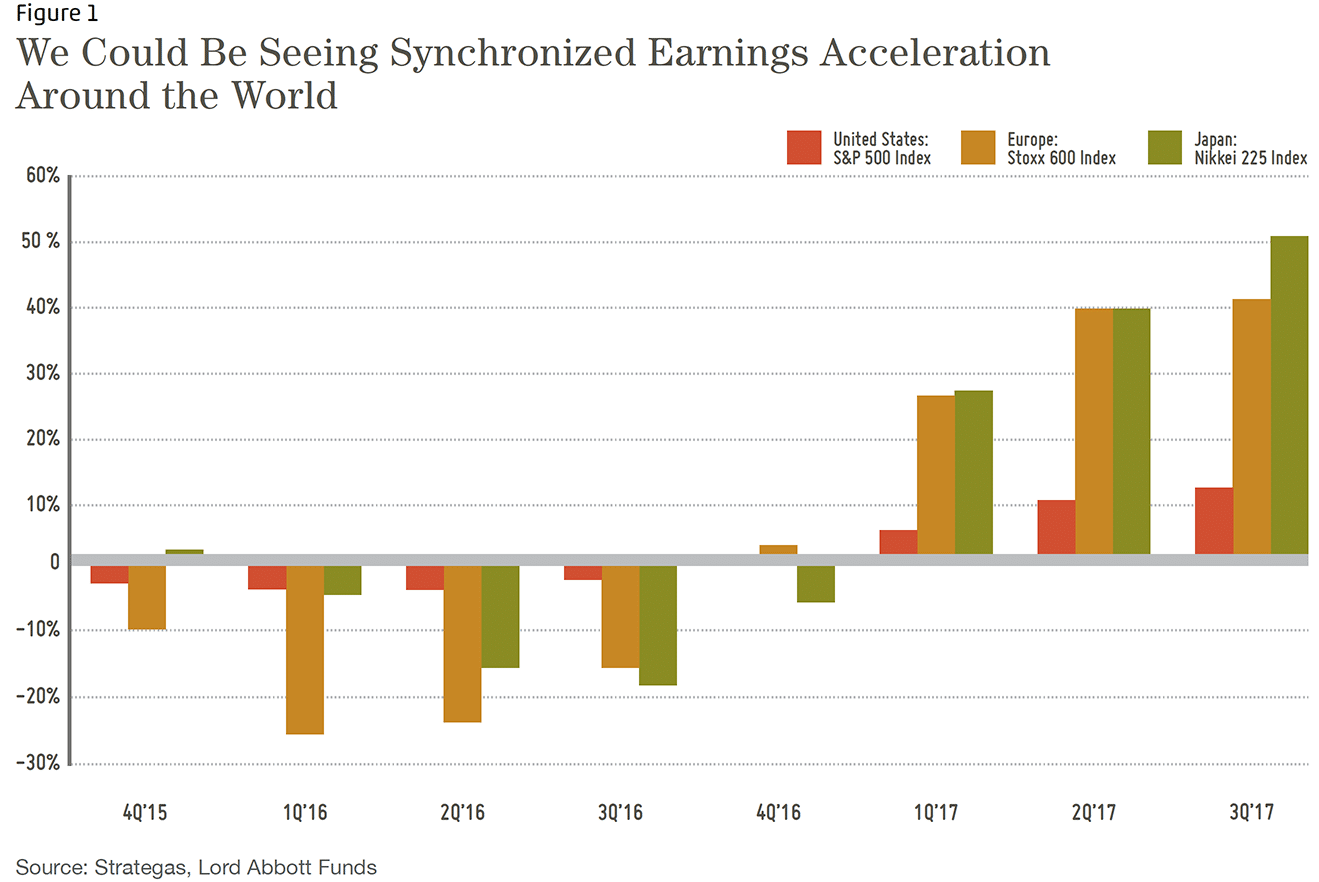
Stock prices are rising because the economic fundamentals are excellent. Synchronized global growth, low interest rates, high profit margins, low inflation, no major credit excesses and no obvious, looming trigger events (which could change the outlook) support current and higher prices. Lower corporate tax rates and the likelihood that corporate earnings can still surprise on the upside are positives that can drive stock prices higher.
Figure 1 on the following page is a set of charts from the Lord Abbot mutual fund group. The synchronized earnings acceleration illustrated is a powerful argument for owning stocks.
Interestingly, Bill Miller, a legendary stock picker*, suggested in a recent interview that rising rates could result in stocks gaining as much as 30%. His rationale; in 2013, when 10-year interest rates rose from the mid 2% range to 3%, investor sold their money-losing bond funds and the put that money in stock funds. This is called a ‘flow of funds’ argument for higher prices; investors chase ‘what is working’ after selling ‘what is not working’ and it is certainly possible. www.cnbc.com/2018/01/09/legendary-investor-bill-miller-market-could-be-headed-for-a-melt-up-of-30-percent.html
Another argument in favor of stock valuation remaining high is that investors don’t care about valuation because they must put their savings somewhere. Their 401k investments are on auto-pilot, and the shift of investors to buying stock index funds will continue to push stock prices higher.
*Mr. Miller had a terrific track record from 1991 to 2005 but was crushed, losing more than 50% in 2008 after losing 6.6% in 2007. He has posted better results in recent years.
The Bearish Case for Stocks
Stocks are significantly overpriced when compared to long term valuation metrics. Among the most reliable measures of long term stock performance is the Schiller PE aka CAPE (Cyclically Adjusted Price Earnings ratio). This measure averages the annual earnings of the S&P 500 over the previous 10 year period and compares it to current prices. This measure was tested to determine whether it was useful in estimating future stock returns. The figures below describe the results.
If you study figures 2 & 3 above, you can see that it’s possible to have good returns even when the stock market is expensive by historical measures (CAPE 25 & Higher). During the Dot-Com mania the ratio reached almost 45. Unfortunately, the ratio offers no insight into what events could trigger the poor performance.
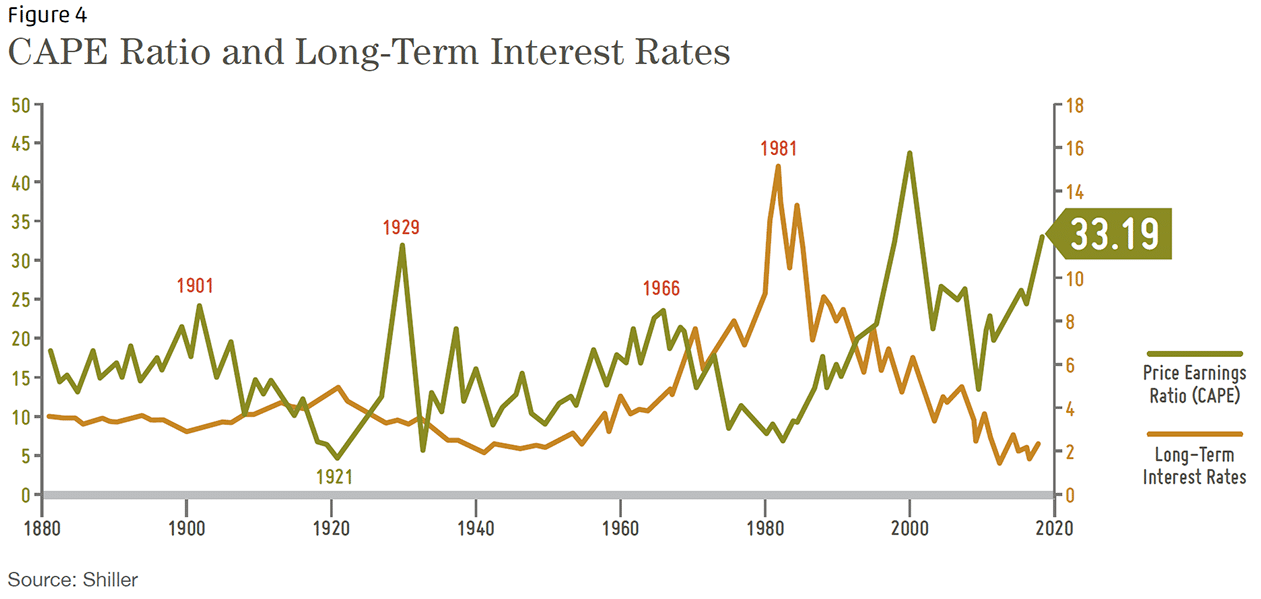
We might infer from the data table that when the CAPE ratio is over 25, on average something negative happens between years 3 and 5 because the 2.1% average 5 year period returns are worse than the 3.9% average 3 year periods. On a quarterly basis, the Shiller CAPE hit 25 in March of 2014 and with the exception of September 2015 (24.5) the ratio has increased ever since. See Figure 4 on the following page.
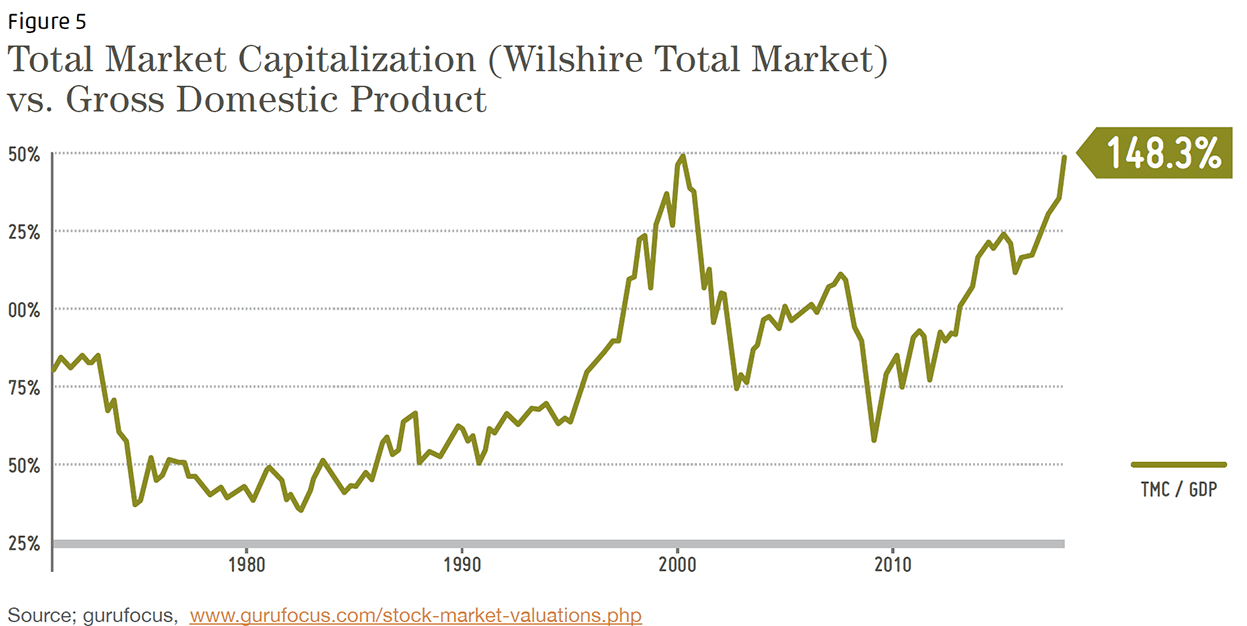
The January 14, 2018 CAPE of 33.19 is above the September 1929 CAPE ratio of 32.9. A high CAPE ratio is analogous to an extremely high blood pressure reading – it doesn’t mean a stroke or heart attack will occur, rather, it indicates the odds of a seriously adverse event are much higher. Warren Buffet, among the world’s most successful stock investors, favors a market value to GDP ratio as a quick measure of valuation – the higher the ratio, the worse the future returns will likely be. By this measure, stock market valuation is on par with the Dot-Com bubble (See figure 5, below).
Both Bullish and Bearish Cases are Correct – It Just Comes Down to ‘When’
In the short run, perhaps six months to two years, stocks could climb even higher as the positive global economic trends become self-reinforcing. There is a recent well-articulated rationale, written by Jeremy Grantham of GMO, for a final stock mania episode taking prices significantly above current levels before collapsing. For more information google: ‘Jeremy Grantham, Melt-up’ – the web is awash in comments about this article.
Margin of Safety as a Fiduciary Principle
Some 35 years ago, among the first books I read on investing was Benjamin’s Graham’s The Intelligent Investor. Chapter 20 introduced the concept of “margin of safety” (Warren Buffet said Graham’s book changed his life, and he became a student of Graham’s at Columbia).
When investing in stocks, margin of safety refers to buying an investment at a price far enough below your estimate of its current value so that, if you turn out to be wrong in your assessment, you are less likely to be significantly harmed. What applies to stocks can apply to any investment or an entire portfolio.
Margin of safety, in the context of investing in the stock or bond market, means managing your risk exposure based on current and historical indicators of value while considering your personal circumstances.
Every portfolio represents a bet that what we own today will improve rather than harm our financial well-being in the future. The future offers many possible outcomes – some of those could exceed historical precedents – to the upside or the downside.
It’s Your Money. How Much Margin of Safety Do You Want?
For all of us, money evokes a complex tangle of conscious and subconscious feelings and meanings. I have my own sense margin of safety when it comes to managing my client’s life savings and my own money. The margin of safety principal measures investment success not only by how much you make, but by how badly you can be harmed if you are wrong.
In summary, if you feel that your portfolio is “too safe,” and you would like more stock exposure, please contact me. I have increased stock exposure for several clients.
Thank you for your trust and confidence in our efforts to make money as worry free as possible.
1MCS Family Wealth Advisors (MCS) consolidated client returns are dollar-weighted, net of investment management fees unless stated otherwise, include reinvestment of dividends and capital gains and represent all clients with fully discretionary accounts under management for at least one full month in 2017. Individual client returns represent client discretionary accounts under management for the entire period – starting on 12/31/2016 and ending on 12/31/2017. These accounts represent 97% of MCS’s discretionary fee-paying assets under management as of 12/31/2017 and were invested primarily in US stocks and bonds (15% of client assets on 12/31/2017 were invested in tax-exempt municipal bonds). The Stock Index values are based on the S&P 500 Total Return Index, which measures the large-capitalization US equity market. The Bond Index values are based on the Barclays Capital US Aggregate Bond Index, which measures the US investment-grade bond market. Index values are for comparison purposes only. The report is for information purposes only and does not consider the specific investment objective, financial situation, or particular needs of any recipient, nor is it to be construed as an offer to sell or solicit investment management or any other services. Past performance is not indicative of future results.
Categories
2017 Year End Newsletter & Outlook1
Year End Results
If MCS clients’ investments were treated as one large portfolio including their cash, on average clients gained 4.28% in 2017, after fees. The range of individual client returns was from 0.90% to 12.73%. For comparison purposes, the S&P 500 Total Return Stock index earned 21.83%, and the Barclays Aggregate Bond Index was up 3.54%.
Clients who outperformed had higher equity balances and a lower cash-and-short-term bond allocation due to higher cash flow needs. Clients who underperformed were new clients with funds recently invested in short term bonds, those who had lower equity allocations, or clients who held low basis stock that underperformed this year.
As 2017 closed out, article after news article described the most significant current risk to the market as a pickup of inflation and subsequent increase in interest rates.
The concerns that I began writing about in mid-2016 had finally found other voices. Here’s a sample:
Source: Goldman Sachs, Bloomberg, 11/29/2017
Source: GMO 12/15/2017 letter to clients, Bloomberg, 12/21/2017
Source: Barron’s, 01/01/2018
Source: Bloomberg, 01/03/2018
Prices of stocks, real estate and bonds remain vulnerable to higher interest rates. The catalyst for higher interest rates would be higher inflation.
Assuming that inflation is not dead, the speed and magnitude of inflation will determine the severity of its impact on asset prices. A slow or modest increase of inflation for a short time would do little or no damage to stock and real estate prices. A rapid – or a robust and steady – increase in inflation, on the other hand, could cause severe drops across all asset classes. The ingredients for higher inflation are the same as those driving stock prices higher; synchronized global growth, potential stimulus from tax cuts, and full employment. Economists are perplexed by the lack of inflationary pressure at this point in the business cycle and rationalize that inflation may simply be taking longer than usual to show up.
The Bullish Case for Stocks
Many clients are unnerved by the President’s behavior, seeing it as a source of significant, albeit hard to quantify, risk for both our country and the world. In the absence of a significant negative shock like a war with North Korea or discovery of information so serious that a GOP-controlled House of Representatives would support impeachment of the President, the financial markets care only about events related to future corporate profits.
Stock prices are rising because the economic fundamentals are excellent. Synchronized global growth, low interest rates, high profit margins, low inflation, no major credit excesses and no obvious, looming trigger events (which could change the outlook) support current and higher prices. Lower corporate tax rates and the likelihood that corporate earnings can still surprise on the upside are positives that can drive stock prices higher.
Figure 1 on the following page is a set of charts from the Lord Abbot mutual fund group. The synchronized earnings acceleration illustrated is a powerful argument for owning stocks.
Interestingly, Bill Miller, a legendary stock picker*, suggested in a recent interview that rising rates could result in stocks gaining as much as 30%. His rationale; in 2013, when 10-year interest rates rose from the mid 2% range to 3%, investor sold their money-losing bond funds and the put that money in stock funds. This is called a ‘flow of funds’ argument for higher prices; investors chase ‘what is working’ after selling ‘what is not working’ and it is certainly possible.
www.cnbc.com/2018/01/09/legendary-investor-bill-miller-market-could-be-headed-for-a-melt-up-of-30-percent.html
Another argument in favor of stock valuation remaining high is that investors don’t care about valuation because they must put their savings somewhere. Their 401k investments are on auto-pilot, and the shift of investors to buying stock index funds will continue to push stock prices higher.
The Bearish Case for Stocks
Stocks are significantly overpriced when compared to long term valuation metrics. Among the most reliable measures of long term stock performance is the Schiller PE aka CAPE (Cyclically Adjusted Price Earnings ratio). This measure averages the annual earnings of the S&P 500 over the previous 10 year period and compares it to current prices. This measure was tested to determine whether it was useful in estimating future stock returns. The figures below describe the results.
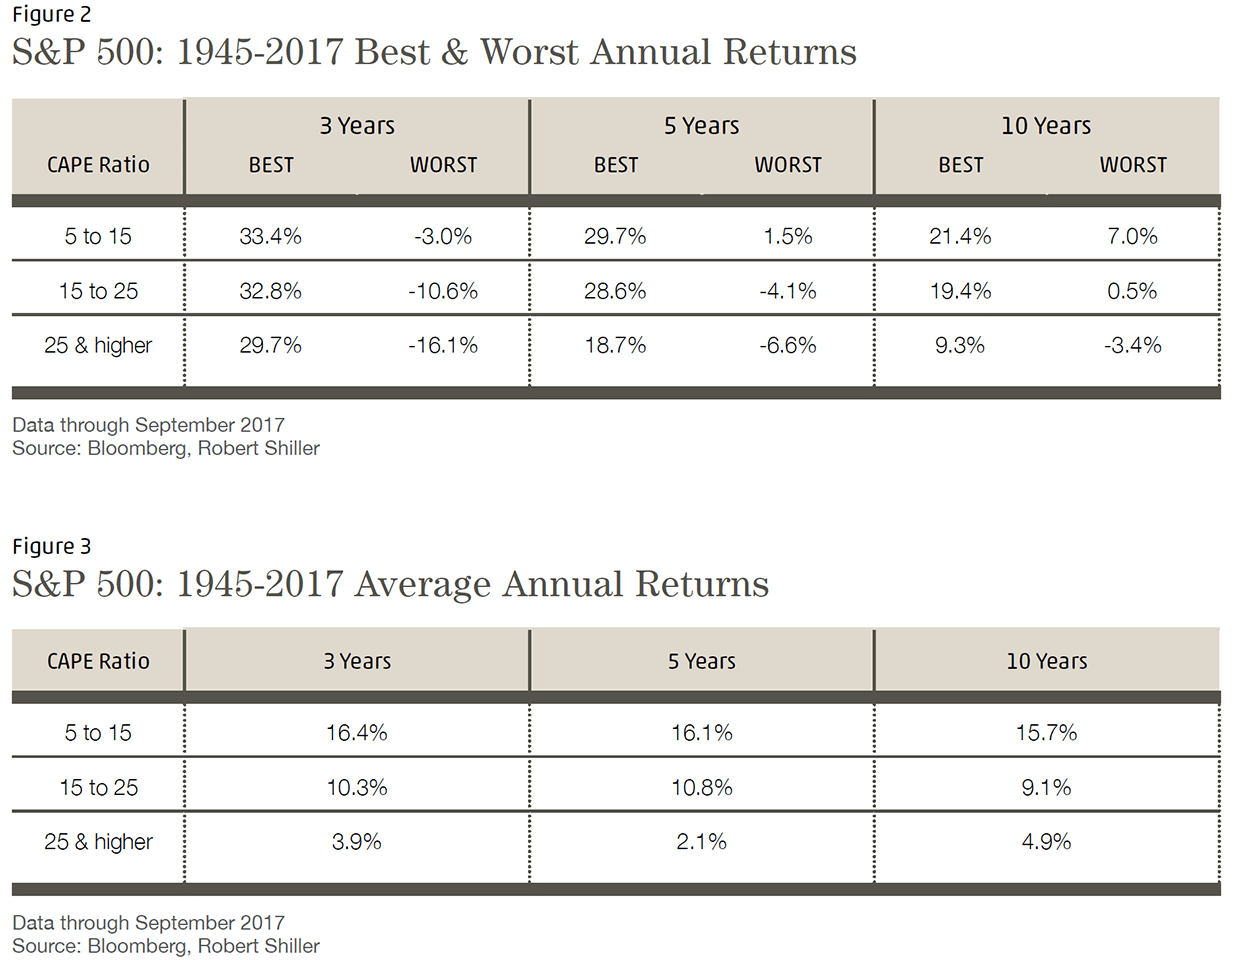
If you study figures 2 & 3 above, you can see that it’s possible to have good returns even when the stock market is expensive by historical measures (CAPE 25 & Higher). During the Dot-Com mania the ratio reached almost 45. Unfortunately, the ratio offers no insight into what events could trigger the poor performance.
We might infer from the data table that when the CAPE ratio is over 25, on average something negative happens between years 3 and 5 because the 2.1% average 5 year period returns are worse than the 3.9% average 3 year periods. On a quarterly basis, the Shiller CAPE hit 25 in March of 2014 and with the exception of September 2015 (24.5) the ratio has increased ever since. See Figure 4 on the following page.
The January 14, 2018 CAPE of 33.19 is above the September 1929 CAPE ratio of 32.9. A high CAPE ratio is analogous to an extremely high blood pressure reading – it doesn’t mean a stroke or heart attack will occur, rather, it indicates the odds of a seriously adverse event are much higher. Warren Buffet, among the world’s most successful stock investors, favors a market value to GDP ratio as a quick measure of valuation – the higher the ratio, the worse the future returns will likely be. By this measure, stock market valuation is on par with the Dot-Com bubble (See figure 5, below).
Both Bullish and Bearish Cases are Correct – It Just Comes Down to ‘When’
In the short run, perhaps six months to two years, stocks could climb even higher as the positive global economic trends become self-reinforcing. There is a recent well-articulated rationale, written by Jeremy Grantham of GMO, for a final stock mania episode taking prices significantly above current levels before collapsing. For more information google: ‘Jeremy Grantham, Melt-up’ – the web is awash in comments about this article.
Margin of Safety as a Fiduciary Principle
Some 35 years ago, among the first books I read on investing was Benjamin’s Graham’s The Intelligent Investor. Chapter 20 introduced the concept of “margin of safety” (Warren Buffet said Graham’s book changed his life, and he became a student of Graham’s at Columbia).
When investing in stocks, margin of safety refers to buying an investment at a price far enough below your estimate of its current value so that, if you turn out to be wrong in your assessment, you are less likely to be significantly harmed. What applies to stocks can apply to any investment or an entire portfolio.
Margin of safety, in the context of investing in the stock or bond market, means managing your risk exposure based on current and historical indicators of value while considering your personal circumstances.
Every portfolio represents a bet that what we own today will improve rather than harm our financial well-being in the future. The future offers many possible outcomes – some of those could exceed historical precedents – to the upside or the downside.
It’s Your Money. How Much Margin of Safety Do You Want?
For all of us, money evokes a complex tangle of conscious and subconscious feelings and meanings. I have my own sense margin of safety when it comes to managing my client’s life savings and my own money. The margin of safety principal measures investment success not only by how much you make, but by how badly you can be harmed if you are wrong.
In summary, if you feel that your portfolio is “too safe,” and you would like more stock exposure, please contact me. I have increased stock exposure for several clients.
Thank you for your trust and confidence in our efforts to make money as worry free as possible.