If MCS clients’ investments were treated as one large portfolio including their cash, on average clients gained 2.68% so far this year (through June 30, 2017), after fees. The range of individual client returns was from 0.60% to 8.24%. For comparison purposes, the S&P 500 Total Return Stock index earned 9.34%, and the Barclays Aggregate Bond Index was up 2.27%.
Clients who outperformed had higher equity balances, a lower cash-and-short-term bond allocation due to higher cash flow needs, and owned prison bonds that recovered. Clients who underperformed were new clients with funds recently invested in short term bonds, those who had lower equity allocations, or clients who held low basis stock that underperformed this year.
The first six months of 2017 has seen both stocks and bonds gain , with stocks easily besting bonds.
It was widely reported that the Trump / Republican stock rally of 2016 was based on the expectation of significant changes: reducing regulations, renegotiating foreign trade, increased infrastructure spending, and lowering tax rates for businesses and high-income earners. However, Trump’s campaign promises have been subsumed into the morass of competing GOP factions.
A simpler narrative explains the market’s sustained stock and bond gains. The global economy has now entered a synchronistic state of steady yet unremarkable growth, while inflation retreated from its 2016 climb. Global growth and lowered inflation expectations are potent fuel for boosting asset prices.
My investment strategy has been heavily influenced by the same factors that Fed Chair Janet Yellen and the rest of the Federal Reserve Board pay attention to: a tightening labor market, combined with steady economic growth, can lead to higher inflation, higher interest rates and more volatility in bonds and stocks. This is potentially dangerous territory for asset values.
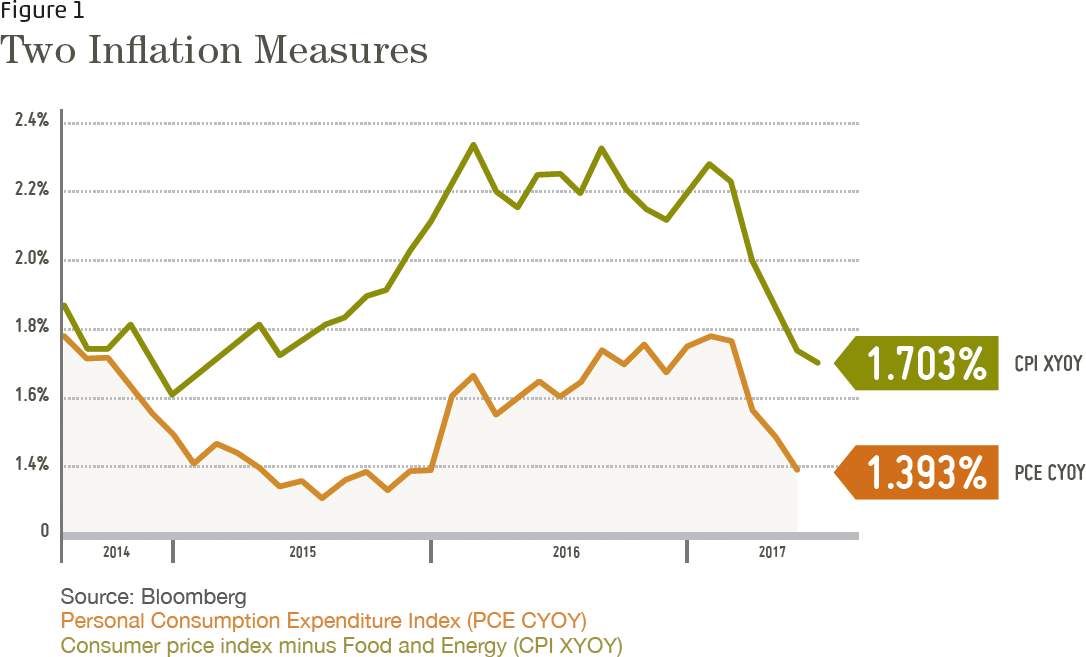
As you can see in Figure 1 below, two popular measures of inflation remained elevated during 2016 before declining this year.
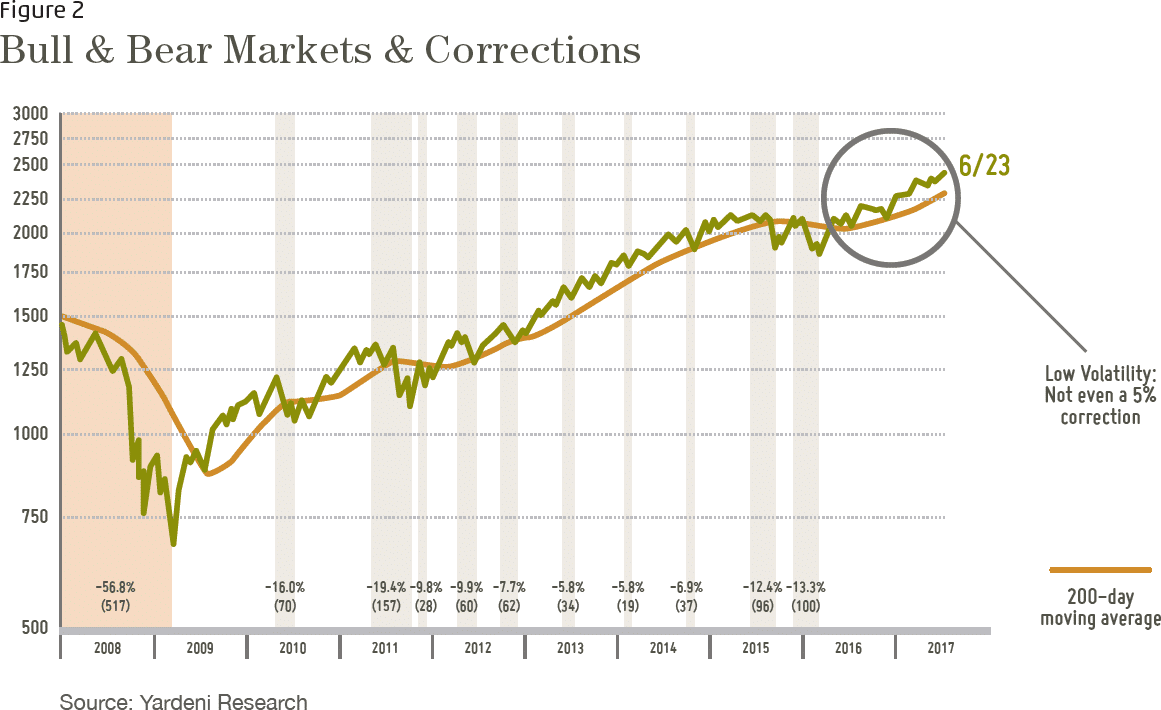
Recent stock market gains have been noteworthy for the lack of volatility (price fluctuations in green). See Figure 2 below. Low volatility makes stocks appear less risky.
Why this environment makes me uncomfortable
Prices are high, and a basic axiom of finance is that today’s high prices imply low – and potentially negative – returns tomorrow. For example, as of May 2017, GMO, an institutional money manager with a solid reputation for asset return forecasts, expects US Stocks to earn a minus 4% return after inflation over the next 7 years!
In the past, when assets like stocks or real estate declined, high quality bonds would gain. This negative correlation (i.e. stocks zig while bonds zag) makes for a stable portfolio. Bond gains plus the bond income would offset declines in stocks and real estate. For long term clients, this is one reason you made money consistently during the worst decade for stocks since the Great Depression (2000 to 2010), having nary a scratch on you despite the havoc wreaked on most investors.
However, there are periods in economic history when both stocks and bonds move in the same direction (positive correlation). Positive correlation means poor diversification. It is made worse when bonds offer very little income to live on should financial markets turn hostile. Today, the only assets that offer any counter balance to long term assets – like stocks, real estate, and (under some circumstances) long term bonds – are money market funds and short term bonds (1-2 yrs.). Gold is too unpredictable.
At the risk of sounding like a broken record, I invite you to talk with me about your portfolio if you feel like you would like to own more stocks. It’s easy enough to implement. I have done this for a few clients who felt they were ready to accept higher potential losses in exchange for higher potential returns.
1 MCS Family Wealth Advisors (MCS) consolidated client returns are dollar-weighted, net of investment management fees unless stated otherwise, include reinvestment of dividends and capital gains and represent all clients with fully discretionary accounts under management for at least one full month in 2017. Individual client returns represent client discretionary accounts under management for the entire period – starting on 12/31/2016 and ending on 06/30/2017. These accounts represent 97% of MCS’s discretionary fee-paying assets under management as of 06/30/2017 and were invested primarily in US stocks and bonds (17% of client assets on 06/30/2017 were invested in tax-exempt municipal bonds). The Stock Index values are based on the S&P 500 Total Return Index, which measures the large-capitalization US equity market. The Bond Index values are based on the Barclays Capital US Aggregate Bond Index, which measures the US investment-grade bond market. Index values are for comparison purposes only. The report is for information purposes only and does not consider the specific investment objective, financial situation, or particular needs of any recipient, nor is it to be construed as an offer to sell or solicit investment management or any other services. Past performance is not indicative of future results.
Categories
2017 Second Quarter Newsletter & Outlook1
If MCS clients’ investments were treated as one large portfolio including their cash, on average clients gained 2.68% so far this year (through June 30, 2017), after fees. The range of individual client returns was from 0.60% to 8.24%. For comparison purposes, the S&P 500 Total Return Stock index earned 9.34%, and the Barclays Aggregate Bond Index was up 2.27%.
Clients who outperformed had higher equity balances, a lower cash-and-short-term bond allocation due to higher cash flow needs, and owned prison bonds that recovered. Clients who underperformed were new clients with funds recently invested in short term bonds, those who had lower equity allocations, or clients who held low basis stock that underperformed this year.
The first six months of 2017 has seen both stocks and bonds gain , with stocks easily besting bonds.
It was widely reported that the Trump / Republican stock rally of 2016 was based on the expectation of significant changes: reducing regulations, renegotiating foreign trade, increased infrastructure spending, and lowering tax rates for businesses and high-income earners. However, Trump’s campaign promises have been subsumed into the morass of competing GOP factions.
A simpler narrative explains the market’s sustained stock and bond gains. The global economy has now entered a synchronistic state of steady yet unremarkable growth, while inflation retreated from its 2016 climb. Global growth and lowered inflation expectations are potent fuel for boosting asset prices.
My investment strategy has been heavily influenced by the same factors that Fed Chair Janet Yellen and the rest of the Federal Reserve Board pay attention to: a tightening labor market, combined with steady economic growth, can lead to higher inflation, higher interest rates and more volatility in bonds and stocks. This is potentially dangerous territory for asset values.
As you can see in Figure 1 below, two popular measures of inflation remained elevated during 2016 before declining this year.
Recent stock market gains have been noteworthy for the lack of volatility (price fluctuations in green). See Figure 2 below. Low volatility makes stocks appear less risky.
Why this environment makes me uncomfortable
Prices are high, and a basic axiom of finance is that today’s high prices imply low – and potentially negative – returns tomorrow. For example, as of May 2017, GMO, an institutional money manager with a solid reputation for asset return forecasts, expects US Stocks to earn a minus 4% return after inflation over the next 7 years!
In the past, when assets like stocks or real estate declined, high quality bonds would gain. This negative correlation (i.e. stocks zig while bonds zag) makes for a stable portfolio. Bond gains plus the bond income would offset declines in stocks and real estate. For long term clients, this is one reason you made money consistently during the worst decade for stocks since the Great Depression (2000 to 2010), having nary a scratch on you despite the havoc wreaked on most investors.
However, there are periods in economic history when both stocks and bonds move in the same direction (positive correlation). Positive correlation means poor diversification. It is made worse when bonds offer very little income to live on should financial markets turn hostile. Today, the only assets that offer any counter balance to long term assets – like stocks, real estate, and (under some circumstances) long term bonds – are money market funds and short term bonds (1-2 yrs.). Gold is too unpredictable.
At the risk of sounding like a broken record, I invite you to talk with me about your portfolio if you feel like you would like to own more stocks. It’s easy enough to implement. I have done this for a few clients who felt they were ready to accept higher potential losses in exchange for higher potential returns.