The third quarter ended strong for US stocks and weak for bonds. As October ends, stocks have given back this year’s gains. Investors are getting a potent reminder of the relationship between risk and return. This quarter’s newsletter describes a substantial risk to investors that is hiding in plain sight: corporations’ intoxication with debt. I describe how a very bad hangover is likely to follow.
Performance Update1
The third quarter ended strong for US stocks and weak for bonds. As October ends, stocks have given back this year’s gains. Investors are getting a potent reminder of the relationship between risk and return. This quarter’s newsletter describes a substantial risk to investors that is hiding in plain sight: corporations’ intoxication with debt. I describe how a very bad hangover is likely to follow.
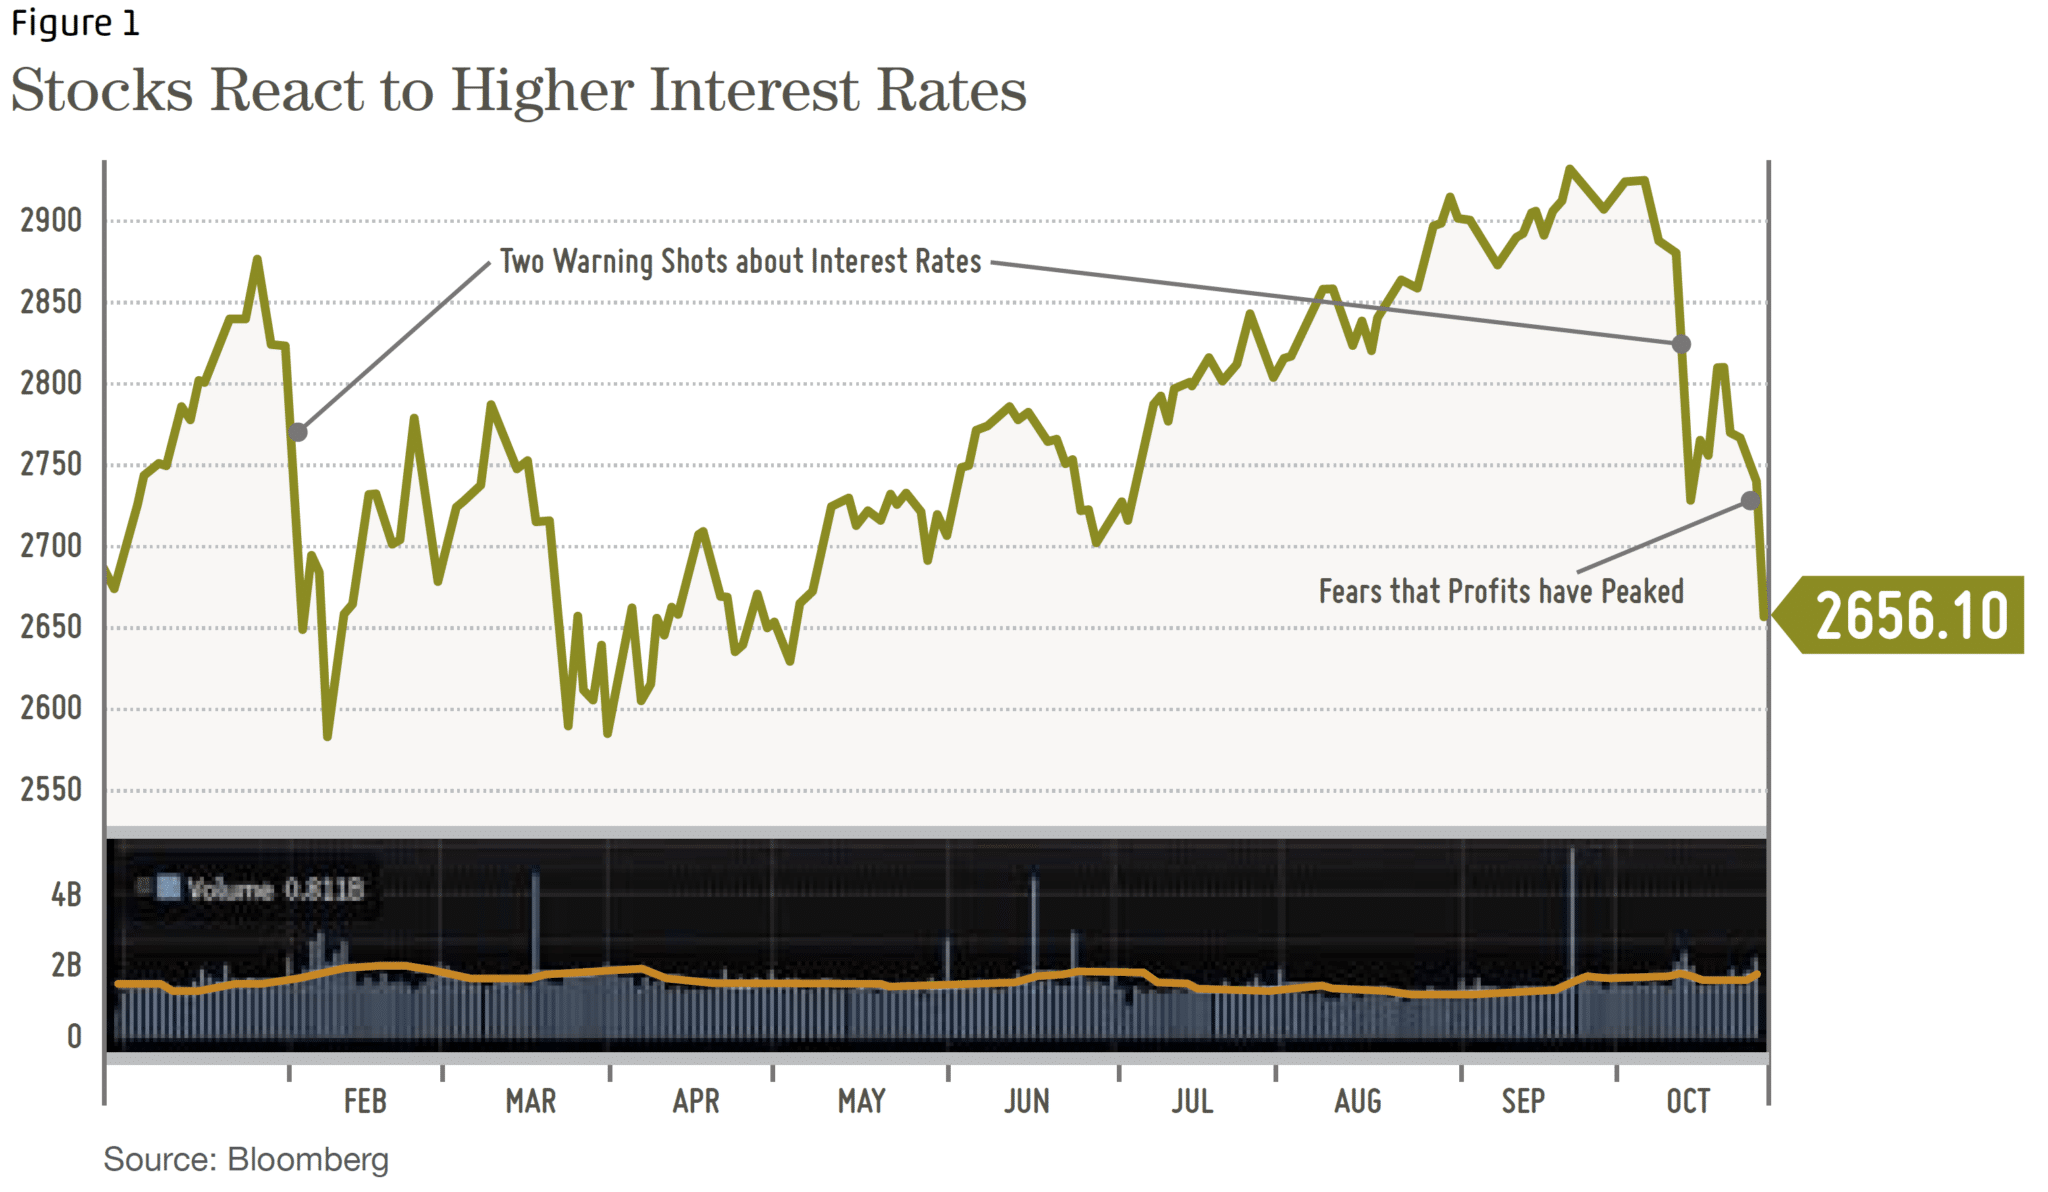
Year to date performance of the S&P 500 stock market index
In my first quarter newsletter, I discussed the warning shot that occurred in February; as interest rates surged, stocks fell, giving up their January ‘tax reform’ gains. After the February decline, stocks shook off interest rate worries and recovered to new highs and then, in October, another warning shot.
Here’s how Akane Otani described it in the October 16 print edition of the Wall Street Journal:
Small Caps Hit by Rising Yields
Shares of US-focused firms are Slumping, forcing investors to reassess long standing bets
Shares of small, US –focused firms are suffering their worst route in years, removing another pillar support for the nine year bull market as it faces heightened turmoil.
As government bond yields have climbed to multi-year highs, investors are being for to reassess longstanding bets-that are faltering after thriving for years in a low-rate environment
Her article led with small company stocks, yet the same principles apply to large company stocks. Given the strong economy, I would not be surprised to see stocks recover from this recent dip; however, these two warning shots about interest rates and stock prices are instructive:
A reminder that Down is usually much faster than Up when it comes to financial markets. Losing 3% to 5% in a day is well within the normal range of volatility.
Just as the stock market may go up before difficult economic times end in anticipation of better times, the market can go down before good times end in anticipation of more difficult times.
There is a tipping point at which higher interest rates can cause stock prices to crumble (higher rates are doing this to bonds, and bond index returns are modestly negative for the year).
The tipping point could come quickly or slowly depending on how the economy and inflation play out.
Stocks can resist the interest rate tipping point as long as earnings growth remains strong. For example, if the tipping point was 3.5% on the 10-Year Treasury bond, stocks could resist succumbing to higher rates with stronger than expected earnings. This could push the tipping point to perhaps 3.75% to 4%.
The Fed is determined to continue to raise short term interest rates given the strong economy. This will likely force long term rates higher as well.
Other market participants believe the Fed will raise short rates and ‘invert the yield curve’ meaning short term rates will be higher than long term rates. An inverted yield curve usually leads to a recession. Recession fears could lead stocks lower as well.
Bubble, Bubble, Toil and Trouble [sic]
Recent stock market behavior reinforces my concerns about how an increase in interest rates threatens clients’ financial security. Many investors are unaware that a “speculative bubble” now exists in US corporate debt, with significant repercussions for both bond and stock investors in the next down turn. A combination of lower credit quality, upcoming debt maturities, increasing interest rates, and the late stage of our business cycle are a recipe for volatile markets.
Decades of declining interest rates have encouraged public companies to take on more debt to buy back their own stock (stock investors approve of buybacks and it’s an easy way for management to boost the value of their stock options). The bonds of many well known companies are now barely above junk bond ratings, and heavily indebted companies are more dependent than ever on continued low interest rates and easily available credit.
What are the Bond Ratings?
Bond ratings provide an excellent indication of the ability of the bond issuer to repay its debt on time. Standard and Poors (S&P), Moody’s, and Fitch are the largest independent credit rating agencies. See: https://en.wikipedia.org/wiki/Bond_credit_rating
A low credit rating does not mean a bond will default, it means that defaults are more frequent among borrowers that have lower credit ratings. See this S&P Global Ratings document for more information: http://bit.ly/2LKLhpn
Corporate Debt Expanding While Credit Quality Deteriorating
The three charts below illustrate these changes. Figure 2 shows the increase in company debt. Figure 3 shows the decrease in credit quality. As you can see, in the late 1980’s, the top two bond ratings (Aaa and Aa) share of Moody’s ratings fell from roughly 60% to about 20% today.
Figure 4, above, shows that the riskiest tier of investment grade bonds has gone from roughly 15% to over 50% of the Barclays Corporate Bond Index. Investors interested in safety naturally prefer “investment grade” bonds (rated from AAA to BBB by S&P, or Aaa to Baa by Moody’s2). Yet, the safety implied by the “investment grade” moniker is weaker than it used to be. A recent Bloomberg article reported: “In 2000, when BBB bonds were a mere third of the market, net leverage (total debt minus cash and short term investments divided by earnings before interest, taxes, depreciation and amortization) was 1.7 times. By the end of last year, the ratio had ballooned to 2.9 times.” Source: Bloomberg, July 10, 2018
What the above statement means is that for bonds in the BBB category, there is far less money available to repay the debt now vs. 2000. Therefore, a BBB rating today is not as good, on average, as BBB rating of 10 years ago. It’s like grade inflation for corporations.
Using a different ratio, the Bank Credit Analyst (BCA) looks at the impact of how a mere 1% interest rate increase impacts the ability of companies to repay their debt. Note: higher interest coverage means more security for the bond investor. “… we estimate the change in the interest coverage ratio over the next three years for a 100 basis point (1%) rise in interest rates across the corporate curve… For the universe of our companies, the interest coverage ratio would drop from about 4 to 2½, well below the lows of the Great Recession. The Consumer Staples, Tech and Health Care are affected most deeply.”
What BCA is saying is that it would not take a large increase in interest rates before many companies will have financial ratios worse than during the Great Recession.
Trouble
A June, 2018 Discussion Paper, ‘Rising Corporate Debt Peril or Promise?’ by McKinsey Global Institute observed that a record amount of bonds will mature over the next five years (at least $3 trillion in the US). New bonds will be issued to pay-off the old bonds, and the trouble begins if the interest rate paid on the new bonds is significantly higher than the interest rate on the maturing bonds. Higher interest costs mean lower earnings for shareholders and increased default risk for bondholders. The paper also noted that credit quality, or the ability of borrowers to repay that debt, has decreased significantly since 2000, and that companies are more indebted than ever before.
To review the Discussion Paper see: https://mck.co/2NV3NvA
What is Default Risk?
This is the risk that a borrower will not be able to meet the terms of their bond (loan). A borrower can be in default even if it is paying its obligations on time. Timely payment is an obvious term (or requirement) of a bond, but other terms could include maintaining specific financial ratios. If the company’s financial ratios deteriorated, it could be in technical default on the loan.
Credit Spreads and Stock Prices
A credit spread is the difference in interest rates between US Treasury debt (the safest bond investment) and corporate debt of the same maturities. The spread represents the extra compensation (in the form of interest rates) an investor requires to hold a bond whose repayment is less secure. Credit spread example: If the 10-year Treasury bond pays 3% and the credit spread is 1%, a corporation borrowing for ten years would pay 4% on their debt (3% + 1%). In a crisis, the spread could easily widen to 4%, so the borrower would have to pay 7% interest (3% + 4%). Now, imagine the 10-year US Treasury note yield rises to 4.5% because of inflation AND credit spreads increase at the same time. The borrower must then pay 8.5% (4.5% + 4%)!
Stock prices are heavily influenced by the interest rate a company pays on its debt. The more interest is paid to bond holders, the less income is available for stockholders. Credit spreads influence stock prices; wider spreads imply lower stock prices and tighter spreads imply higher stock prices.
After a decade of low yields, credit spreads are extremely tight because investors are hungry for extra yield. Additionally, a strong economy gives investors’ confidence their higher risk bonds will be ok – contributing spread tightening.
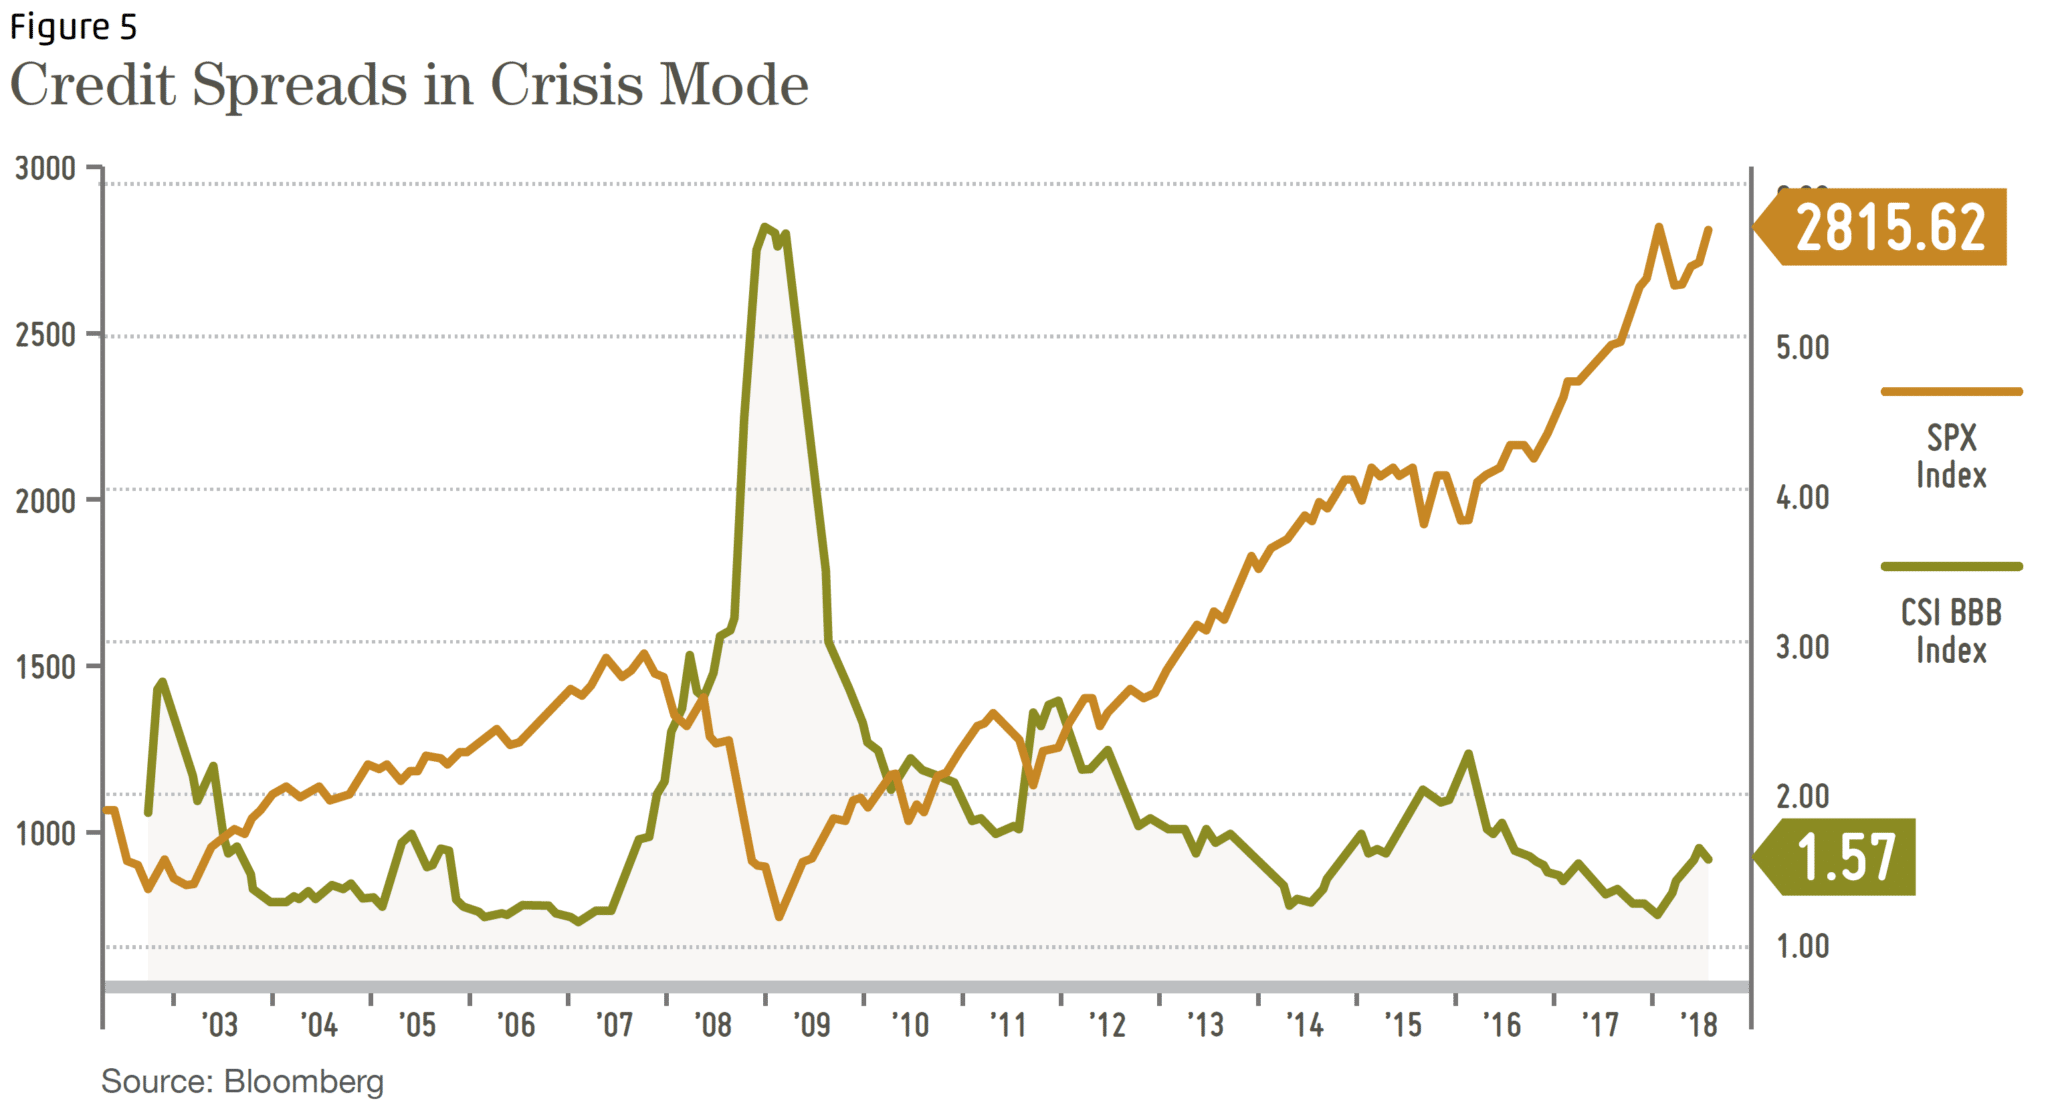
In times of crisis, spreads between safe US Treasury and BBB / Baa rated corporate bonds widen considerably to compensate investors for increased default risk. The chart above shows that at the bottom of the stock market in 2008, 10-year BBB rated corporate bonds paid almost 6% above the yield of the 10-year US Treasury Bond. Note that periods in which spreads increase tend to correspond to, and often lead to, poor stock market performance. Stock prices have soared in part due to low interest rates and low spreads.
What’s Different Today?
As described earlier, corporations are taking on more debt than ever, more of that debt is rated BBB / Baa than ever before, and today’s BBB / Baa rating is actually weaker than past BBB / Baa ratin gs. The weak investment grade rating could easily lead to ratings downgrades during a crisis. A downgrade below investment grade, or the threat of such a downgrade, will increase spreads (amount of yield above safe US Treasury yields) even more, pushing prices lower still and creating a negative feedback loop.
This will cause stock prices and corporate bond prices to be more positively correlated (move in the same direction). More heavily indebted public companies imply worse stock index performance. Once the bond investors demand higher interest rates from companies, stocks may take far longer than expected to recover.
Too Much Debt and Stock Prices
Citigroup is an extreme example of how a company’s stock price can be permanently devalued in a debt crisis. In order to satisfy its creditors during the Great Recession, Citi was forced to sell massive amounts of new stock to improve its financial condition. The additional shares diluted the percentage of the company that the original stockholders owned causing significant losses. A lesser, yet still significant version of this risk exists for stockholders of companies whose debt is rated BBB or lower.
Investors who bought Citigroup stock between 1997 and 2007 will never recoup their investment.
See link: https://cnnmon.ie/2LpNhan
The more debt a company has and the higher its interest payments, the more precarious its financial situation becomes. Typically, a company will first eliminate its dividend. If that is not en ough to improve its financial situation, it may sell more stock and use the proceeds to reduce its debt. The company’s share price will suffer because the additional shares reduce (dilute) the profit available for each share.
See: https://www.investopedia.com/terms/d/dilution.asp
Another way a company can reduce debt is by selling of portions of its business and using the sale proceeds to pay down debt; however, selling assets lowers the future earning potential and value of the business, which is economically similar to issuing more shares.
Summary and Implications
Debt problems play a leading or supporting role in most financial crises. The next crisis will be no different. It does not matter whether the next financial crisis is triggered by higher inflation / higher interest rates, trade wars, or a meltdown of some other kind.
BBB rated bonds are less safe than they have been in the past. It’s a bit reminiscent of the highly rated mortgages bonds of 2005-2008 that were not nearly as safe as expected.
40% of the investment grade corporate debt market is rated BBB and thus very vulnerable to downgrades to junk bond ratings of BB or below. Interest costs can jump significantly when credit spreads widen.
A record amount of corporate debt must be refinanced over the next 5 years. The US government will also issue more bonds to finance its growing deficits. This alone will tend to push interest rates higher.
The bond market will not be liquid in a crisis which will make it more volatile. This is due to regulatory changes to protect banks since the Great Recession. When the selling panic ensues, buyers disappear and the price of lower grade bonds can drop precipitously. This will be very unnerving for both bond and stock investors.
Forced Selling: many institutional investors, including trust companies and mutual funds, have a mandate to hold only investment grade bonds. If BBB-rated investment grade bonds are downgraded to junk (BB or lower), institutional investors may be forced to sell them.
Pile on Effect: forced institutional selling of downgraded bonds would be compounded by frightened retail investors selling their bond funds in response to losses or vice versa.
Stockholders have a ‘last in line’ claim on company assets and earnings. Stock prices plummet when bond credit spreads (which represent future borrowing costs) spike.
1MCS Family Wealth Advisors (MCS) consolidated client returns are dollar-weighted, net of investment management fees unless stated otherwise, include reinvestment of dividends and capital gains and represent all clients with fully discretionary accounts under management for at least one full month during the period. Individual client returns represent client discretionary accounts under management for the entire period – starting on 12/31/2017 and ending on 09/30/2018.These accounts represent 97% of MCS’s discretionary fee-paying assets under management as of 09/30/2018 and were invested primarily in US stocks and bonds (15% of client assets on 09/30/2018 were invested in tax-exempt municipal bonds). The Stock Index values are based on the S&P 500 Total Return Index, which measures the large capitalization US equity market. The Bond Index values are based on the Barclays Capital US Aggregate Bond Index, which measures the US investment-grade bond market. Index values are for comparison purposes only. The report is for information purposes only and does not consider the specific investment objective, financial situation, or particular needs of any recipient, nor is it to be construed as an offer to sell or solicit investment management or any other services. Past performance is not indicative of future results. 2Baa (used by Moody’s) and BBB (used by Standard and Poors) are equivalent ratings. Both Baa and BBB ratings denote the lowest tier of the investment grade bond ratings.
Categories
2018 Third Quarter Newsletter & Outlook
The third quarter ended strong for US stocks and weak for bonds. As October ends, stocks have given back this year’s gains. Investors are getting a potent reminder of the relationship between risk and return. This quarter’s newsletter describes a substantial risk to investors that is hiding in plain sight: corporations’ intoxication with debt. I describe how a very bad hangover is likely to follow.
Performance Update1
The third quarter ended strong for US stocks and weak for bonds. As October ends, stocks have given back this year’s gains. Investors are getting a potent reminder of the relationship between risk and return. This quarter’s newsletter describes a substantial risk to investors that is hiding in plain sight: corporations’ intoxication with debt. I describe how a very bad hangover is likely to follow.
Year to date performance of the S&P 500 stock market index
In my first quarter newsletter, I discussed the warning shot that occurred in February; as interest rates surged, stocks fell, giving up their January ‘tax reform’ gains. After the February decline, stocks shook off interest rate worries and recovered to new highs and then, in October, another warning shot.
Here’s how Akane Otani described it in the October 16 print edition of the Wall Street Journal:
Small Caps Hit by Rising Yields
Shares of US-focused firms are Slumping, forcing investors to reassess long standing bets
Her article led with small company stocks, yet the same principles apply to large company stocks. Given the strong economy, I would not be surprised to see stocks recover from this recent dip; however, these two warning shots about interest rates and stock prices are instructive:
Bubble, Bubble, Toil and Trouble [sic]
Recent stock market behavior reinforces my concerns about how an increase in interest rates threatens clients’ financial security. Many investors are unaware that a “speculative bubble” now exists in US corporate debt, with significant repercussions for both bond and stock investors in the next down turn. A combination of lower credit quality, upcoming debt maturities, increasing interest rates, and the late stage of our business cycle are a recipe for volatile markets.
Decades of declining interest rates have encouraged public companies to take on more debt to buy back their own stock (stock investors approve of buybacks and it’s an easy way for management to boost the value of their stock options). The bonds of many well known companies are now barely above junk bond ratings, and heavily indebted companies are more dependent than ever on continued low interest rates and easily available credit.
What are the Bond Ratings?
Bond ratings provide an excellent indication of the ability of the bond issuer to repay its debt on time. Standard and Poors (S&P), Moody’s, and Fitch are the largest independent credit rating agencies. See: https://en.wikipedia.org/wiki/Bond_credit_rating
A low credit rating does not mean a bond will default, it means that defaults are more frequent among borrowers that have lower credit ratings. See this S&P Global Ratings document for more information: http://bit.ly/2LKLhpn
Corporate Debt Expanding While Credit Quality Deteriorating
The three charts below illustrate these changes. Figure 2 shows the increase in company debt. Figure 3 shows the decrease in credit quality. As you can see, in the late 1980’s, the top two bond ratings (Aaa and Aa) share of Moody’s ratings fell from roughly 60% to about 20% today.
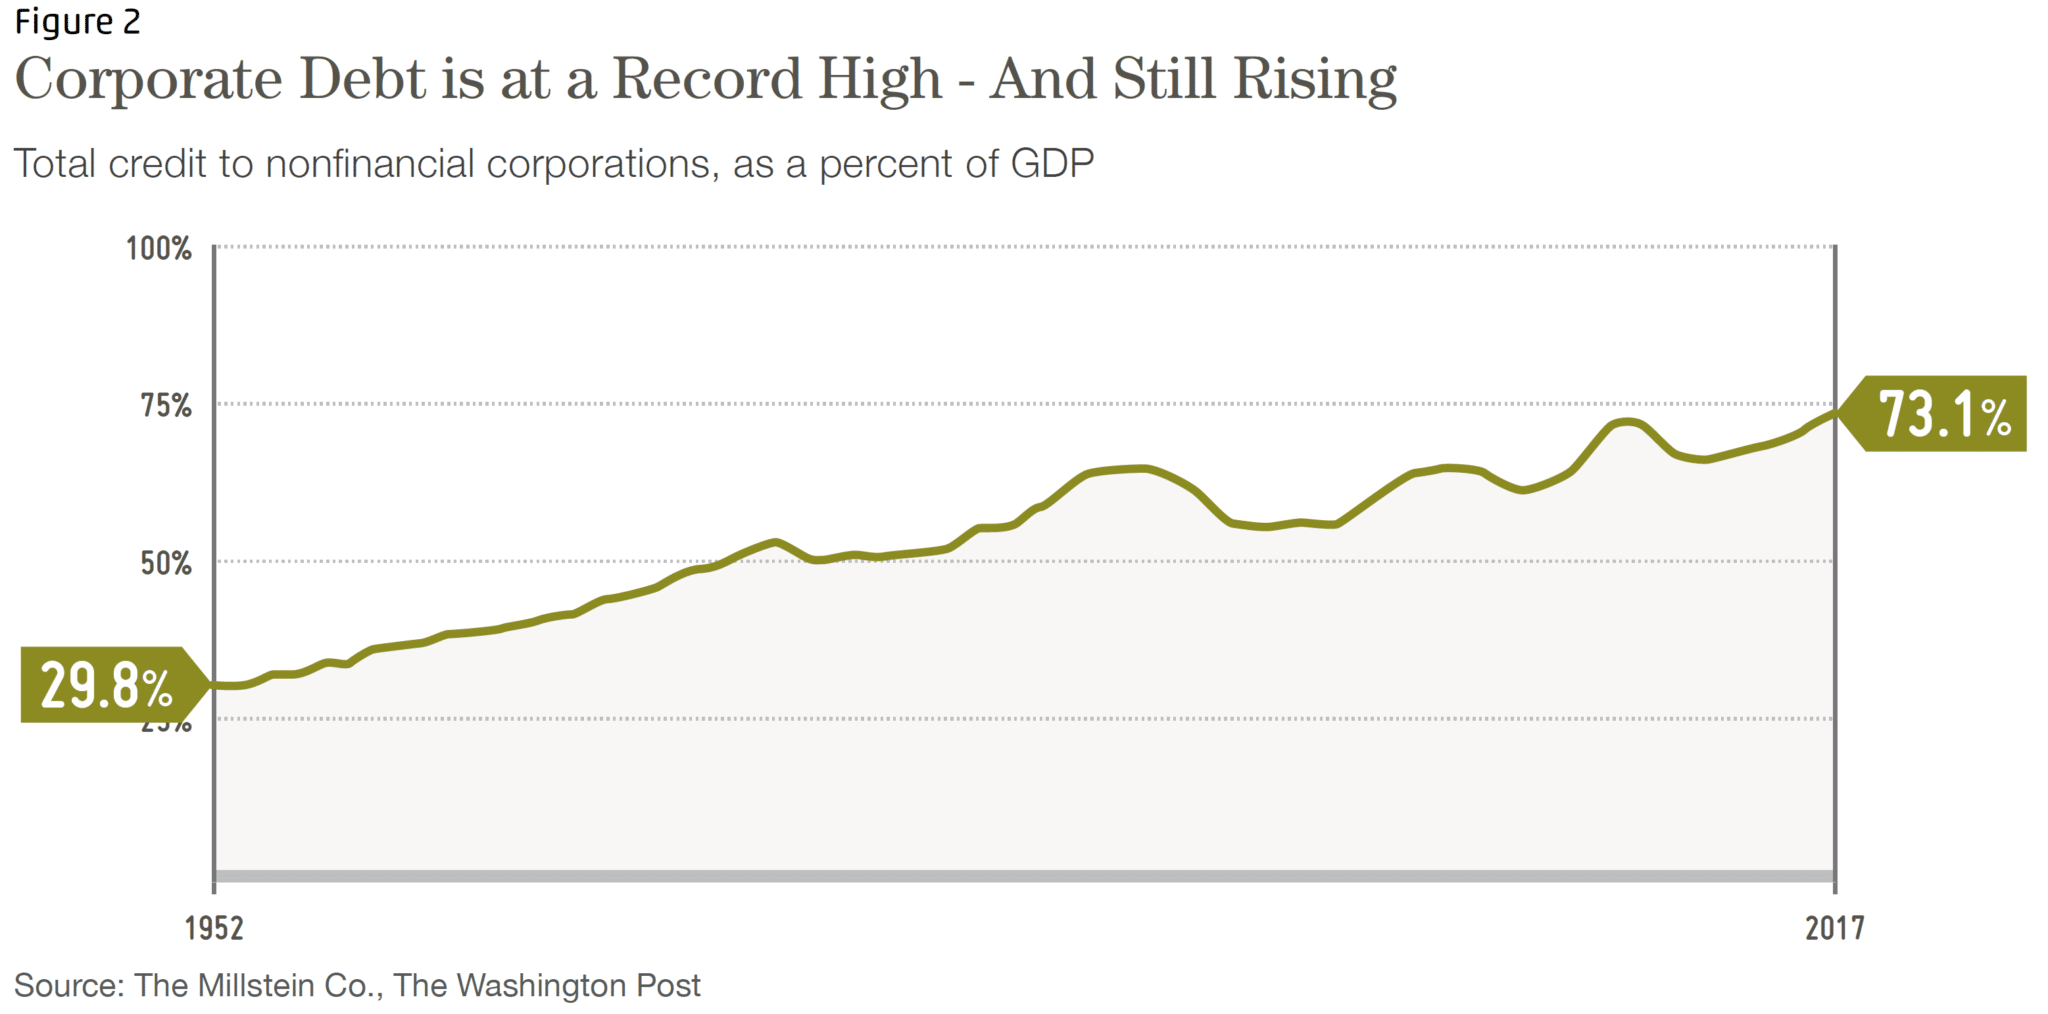
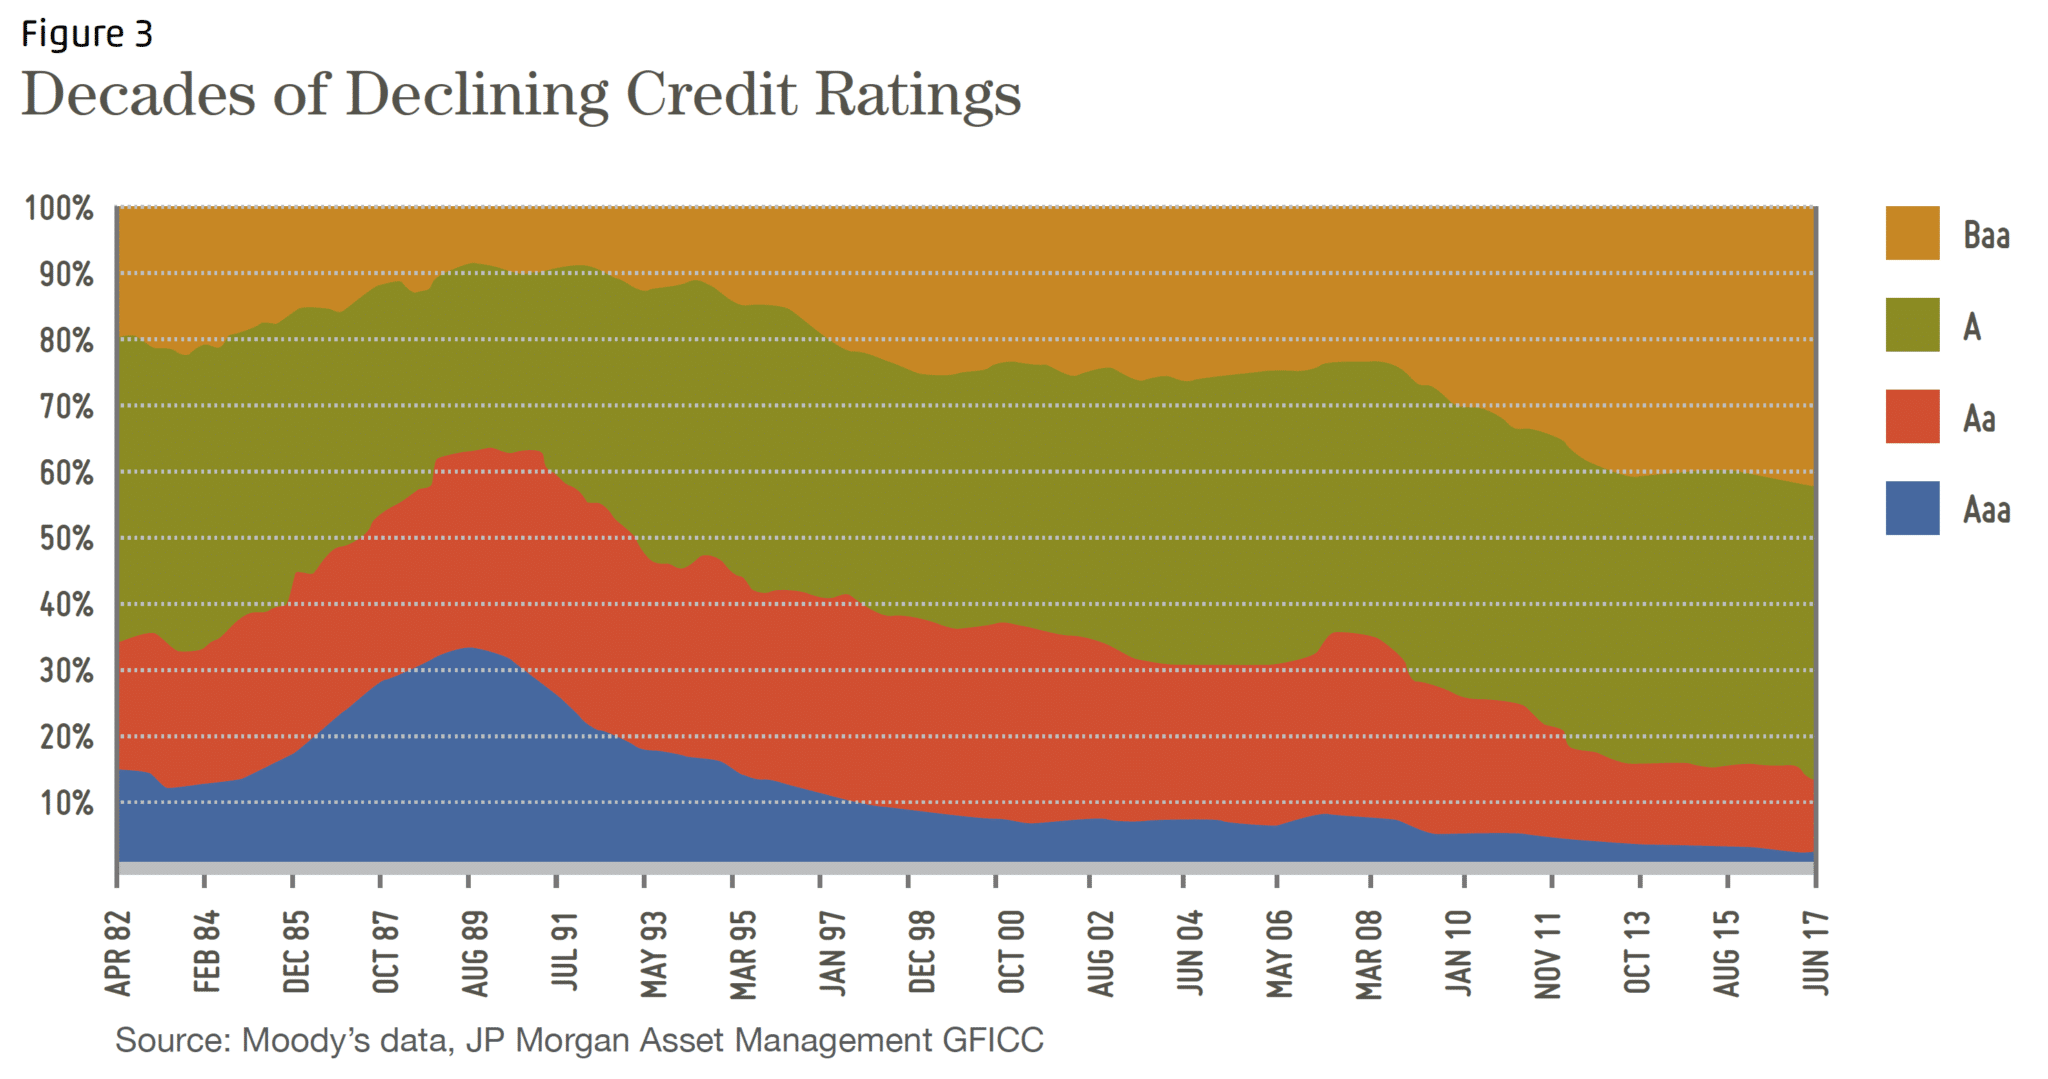
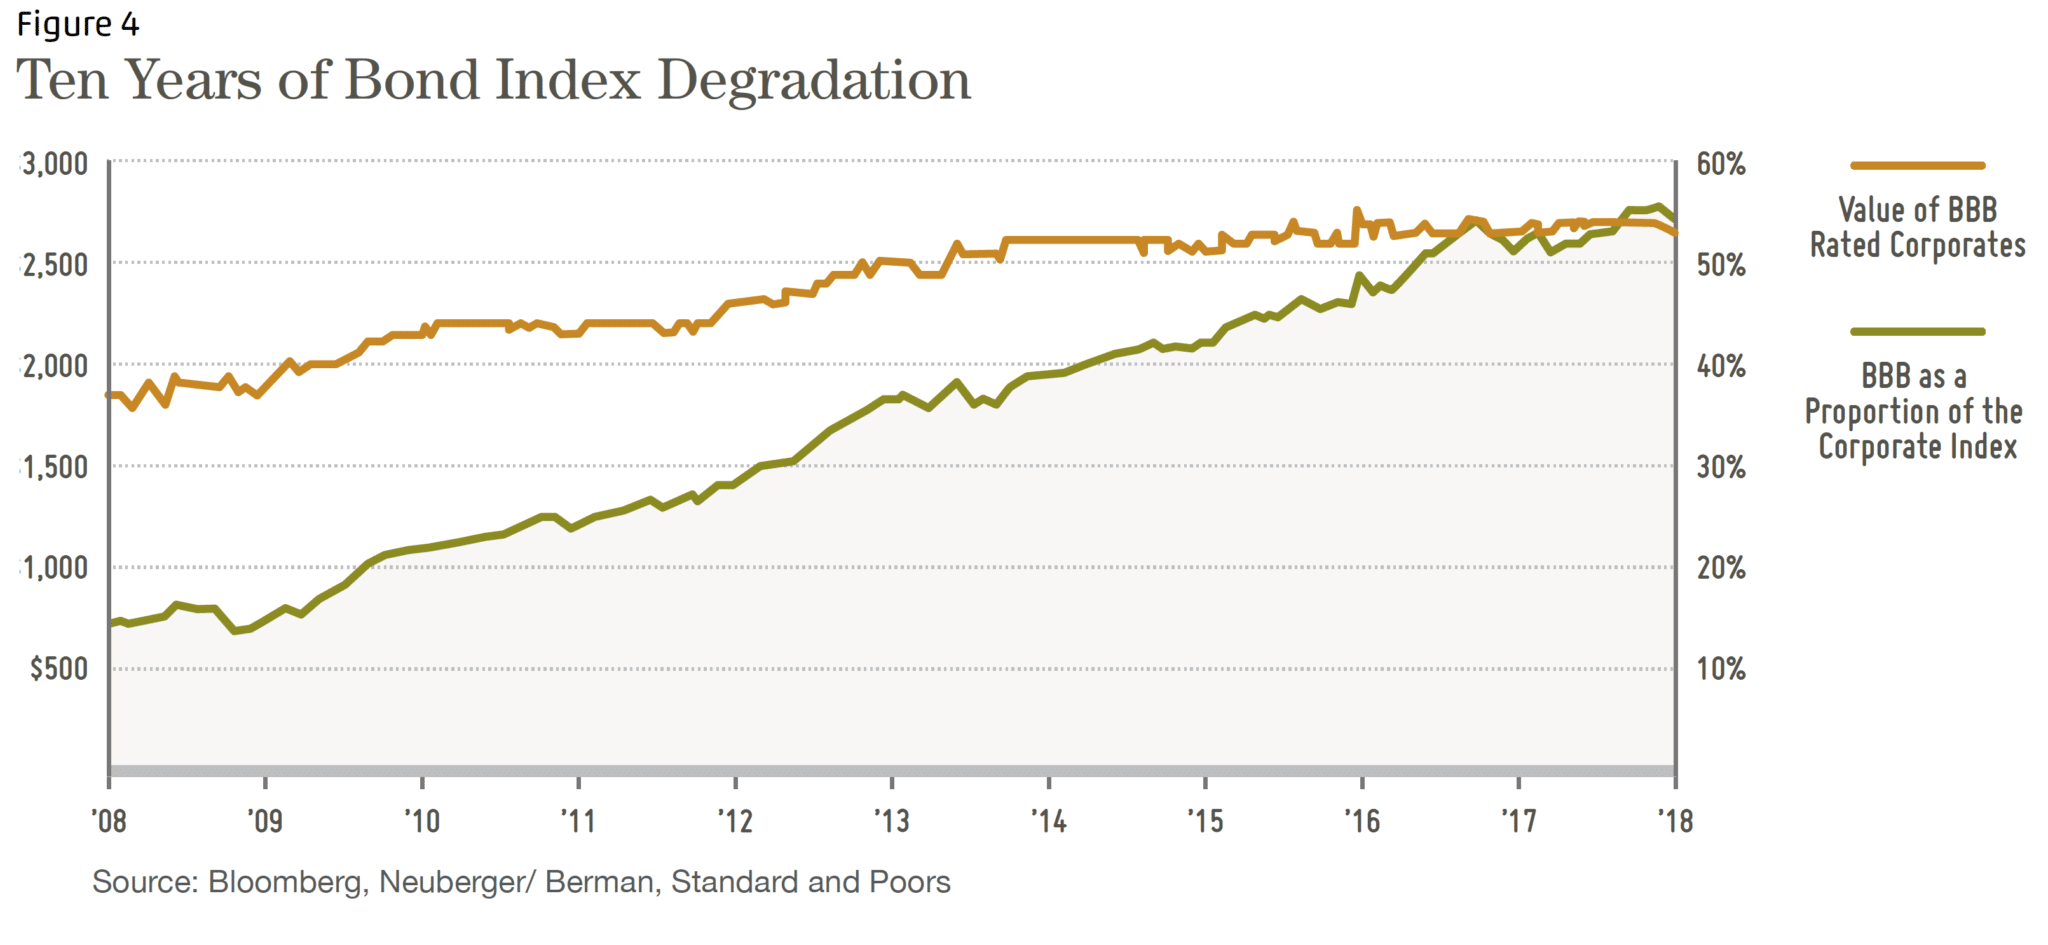
Figure 4, above, shows that the riskiest tier of investment grade bonds has gone from roughly 15% to over 50% of the Barclays Corporate Bond Index. Investors interested in safety naturally prefer “investment grade” bonds (rated from AAA to BBB by S&P, or Aaa to Baa by Moody’s2). Yet, the safety implied by the “investment grade” moniker is weaker than it used to be. A recent Bloomberg article reported:
“In 2000, when BBB bonds were a mere third of the market, net leverage (total debt minus cash and short term investments divided by earnings before interest, taxes, depreciation and amortization) was 1.7 times. By the end of last year, the ratio had ballooned to 2.9 times.” Source: Bloomberg, July 10, 2018
What the above statement means is that for bonds in the BBB category, there is far less money available to repay the debt now vs. 2000. Therefore, a BBB rating today is not as good, on average, as BBB rating of 10 years ago. It’s like grade inflation for corporations.
Using a different ratio, the Bank Credit Analyst (BCA) looks at the impact of how a mere 1% interest rate increase impacts the ability of companies to repay their debt. Note: higher interest coverage means more security for the bond investor.
“… we estimate the change in the interest coverage ratio over the next three years for a 100 basis point (1%) rise in interest rates across the corporate curve… For the universe of our companies, the interest coverage ratio would drop from about 4 to 2½, well below the lows of the Great Recession. The Consumer Staples, Tech and Health Care are affected most deeply.”
What BCA is saying is that it would not take a large increase in interest rates before many companies will have financial ratios worse than during the Great Recession.
Trouble
A June, 2018 Discussion Paper, ‘Rising Corporate Debt Peril or Promise?’ by McKinsey Global Institute observed that a record amount of bonds will mature over the next five years (at least $3 trillion in the US). New bonds will be issued to pay-off the old bonds, and the trouble begins if the interest rate paid on the new bonds is significantly higher than the interest rate on the maturing bonds. Higher interest costs mean lower earnings for shareholders and increased default risk for bondholders. The paper also noted that credit quality, or the ability of borrowers to repay that debt, has decreased significantly since 2000, and that companies are more indebted than ever before.
To review the Discussion Paper see: https://mck.co/2NV3NvA
What is Default Risk?
This is the risk that a borrower will not be able to meet the terms of their bond (loan). A borrower can be in default even if it is paying its obligations on time. Timely payment is an obvious term (or requirement) of a bond, but other terms could include maintaining specific financial ratios. If the company’s financial ratios deteriorated, it could be in technical default on the loan.
Credit Spreads and Stock Prices
A credit spread is the difference in interest rates between US Treasury debt (the safest bond investment) and corporate debt of the same maturities. The spread represents the extra compensation (in the form of interest rates) an investor requires to hold a bond whose repayment is less secure.
Credit spread example: If the 10-year Treasury bond pays 3% and the credit spread is 1%, a corporation borrowing for ten years would pay 4% on their debt (3% + 1%). In a crisis, the spread could easily widen to 4%, so the borrower would have to pay 7% interest (3% + 4%). Now, imagine the 10-year US Treasury note yield rises to 4.5% because of inflation AND credit spreads increase at the same time. The borrower must then pay 8.5% (4.5% + 4%)!
Stock prices are heavily influenced by the interest rate a company pays on its debt. The more interest is paid to bond holders, the less income is available for stockholders. Credit spreads influence stock prices; wider spreads imply lower stock prices and tighter spreads imply higher stock prices.
After a decade of low yields, credit spreads are extremely tight because investors are hungry for extra yield. Additionally, a strong economy gives investors’ confidence their higher risk bonds will be ok – contributing spread tightening.
In times of crisis, spreads between safe US Treasury and BBB / Baa rated corporate bonds widen considerably to compensate investors for increased default risk. The chart above shows that at the bottom of the stock market in 2008, 10-year BBB rated corporate bonds paid almost 6% above the yield of the 10-year US Treasury Bond. Note that periods in which spreads increase tend to correspond to, and often lead to, poor stock market performance. Stock prices have soared in part due to low interest rates and low spreads.
What’s Different Today?
As described earlier, corporations are taking on more debt than ever, more of that debt is rated BBB / Baa than ever before, and today’s BBB / Baa rating is actually weaker than past BBB / Baa ratin gs. The weak investment grade rating could easily lead to ratings downgrades during a crisis. A downgrade below investment grade, or the threat of such a downgrade, will increase spreads (amount of yield above safe US Treasury yields) even more, pushing prices lower still and creating a negative feedback loop.
This will cause stock prices and corporate bond prices to be more positively correlated (move in the same direction). More heavily indebted public companies imply worse stock index performance. Once the bond investors demand higher interest rates from companies, stocks may take far longer than expected to recover.
Too Much Debt and Stock Prices
Citigroup is an extreme example of how a company’s stock price can be permanently devalued in a debt crisis. In order to satisfy its creditors during the Great Recession, Citi was forced to sell massive amounts of new stock to improve its financial condition. The additional shares diluted the percentage of the company that the original stockholders owned causing significant losses. A lesser, yet still significant version of this risk exists for stockholders of companies whose debt is rated BBB or lower.
Investors who bought Citigroup stock between 1997 and 2007 will never recoup their investment.
See link: https://cnnmon.ie/2LpNhan
The more debt a company has and the higher its interest payments, the more precarious its financial situation becomes. Typically, a company will first eliminate its dividend. If that is not en ough to improve its financial situation, it may sell more stock and use the proceeds to reduce its debt. The company’s share price will suffer because the additional shares reduce (dilute) the profit available for each share.
See: https://www.investopedia.com/terms/d/dilution.asp
Another way a company can reduce debt is by selling of portions of its business and using the sale proceeds to pay down debt; however, selling assets lowers the future earning potential and value of the business, which is economically similar to issuing more shares.
Summary and Implications
1MCS Family Wealth Advisors (MCS) consolidated client returns are dollar-weighted, net of investment management fees unless stated otherwise, include reinvestment of dividends and capital gains and represent all clients with fully discretionary accounts under management for at least one full month during the period. Individual client returns represent client discretionary accounts under management for the entire period – starting on 12/31/2017 and ending on 09/30/2018.These accounts represent 97% of MCS’s discretionary fee-paying assets under management as of 09/30/2018 and were invested primarily in US stocks and bonds (15% of client assets on 09/30/2018 were invested in tax-exempt municipal bonds). The Stock Index values are based on the S&P 500 Total Return Index, which measures the large capitalization US equity market. The Bond Index values are based on the Barclays Capital US Aggregate Bond Index, which measures the US investment-grade bond market. Index values are for comparison purposes only. The report is for information purposes only and does not consider the specific investment objective, financial situation, or particular needs of any recipient, nor is it to be construed as an offer to sell or solicit investment management or any other services. Past performance is not indicative of future results.
2Baa (used by Moody’s) and BBB (used by Standard and Poors) are equivalent ratings. Both Baa and BBB ratings denote the lowest tier of the investment grade bond ratings.