Investors are on edge. One good quarter does not a year’s performance make. I interpret the recent market volatility as evidence that we are in the late stage of the economic recovery and bull market. This quarter’s newsletter will follow up briefly on my China comments in the last newsletter, review the market volatility of the past 15 months, and end with a sobering overview of current market valuations.
In the first quarter of 2019 (if MCS clients’ investments were treated as one large portfolio including their cash), on average clients gained 2.09%1, after fees. For comparison purposes, the S&P 500 Total Return Stock Index (S&P 500) gained 13.65%, and the Barclays Aggregate Bond Index gained 2.94%. The range of MCS individual client returns was from a gain of 0.21 % to a gain of 5.43%.
The first quarter of 2019 (when stocks soared) was the mirror image of the fourth quarter of 2018 (when stocks tanked). In fact, over the six-month period of September 30, 2018 to March 31, 2019, the S&P 500 lost 1.72%. The Barclays Aggregate Bond Index gained 2.94% in this period, and MCS clients, on average, gained 0.89%.
MCS clients with the highest returns held concentrated stock positions that outperformed, or they had a comparatively higher equity allocation than other clients. The client with the lowest return had an account that was not yet fully invested, and others who underperformed were similarly concentrated in lower-risk short-term bonds and cash.
Six Months of Market Volitility
The US economy and Federal Reserve Bank’s interest rate policy co-starred with events in China to lead the markets’ recent drama. What follows is a simplified version of the past 15 months to help review where we’ve been and understand where we are now.
Throughout 2018, the global economy had been slowing while the US economy continued its growth. In the US, short-term interest rates were rising in response to US growth and to a tightening labor market, while abroad growth was faltering, and interest rates in China and Germany tracked lower. Long term US rates also rose in response to US economic growth and potential inflation threats from a tight labor market.
A proxy for global growth (not including the US economy) is China, the world’s biggest or second biggest economy (depending on how its measured).
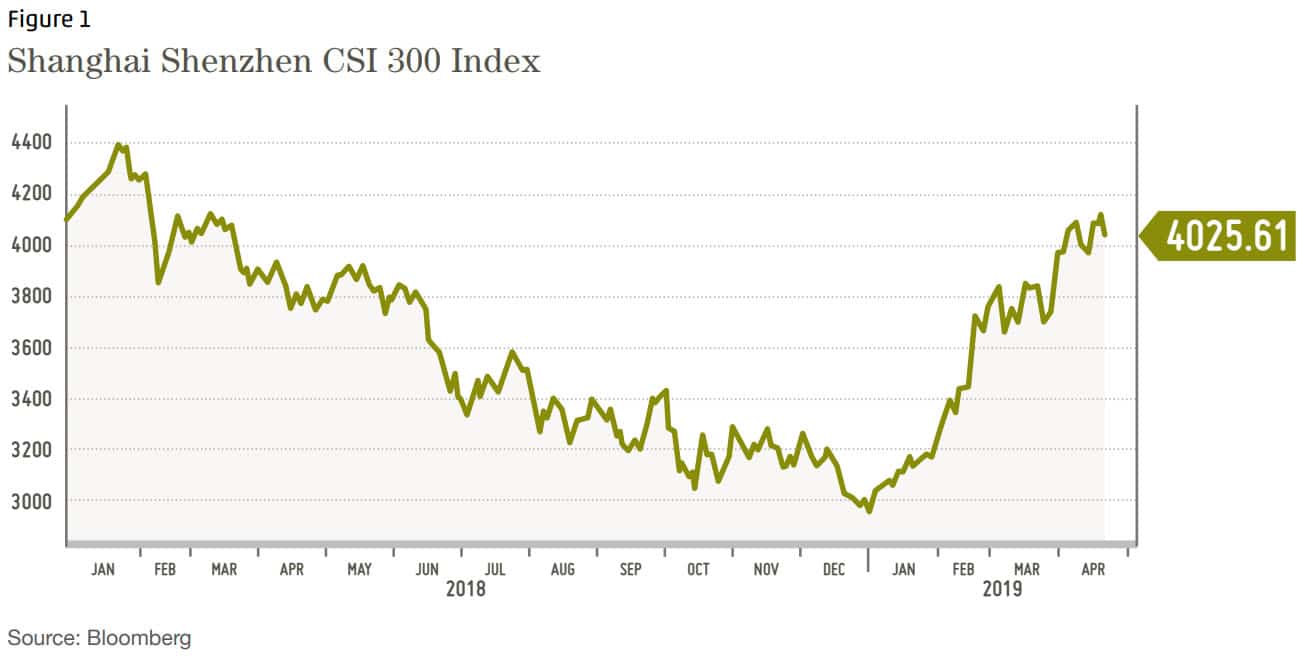
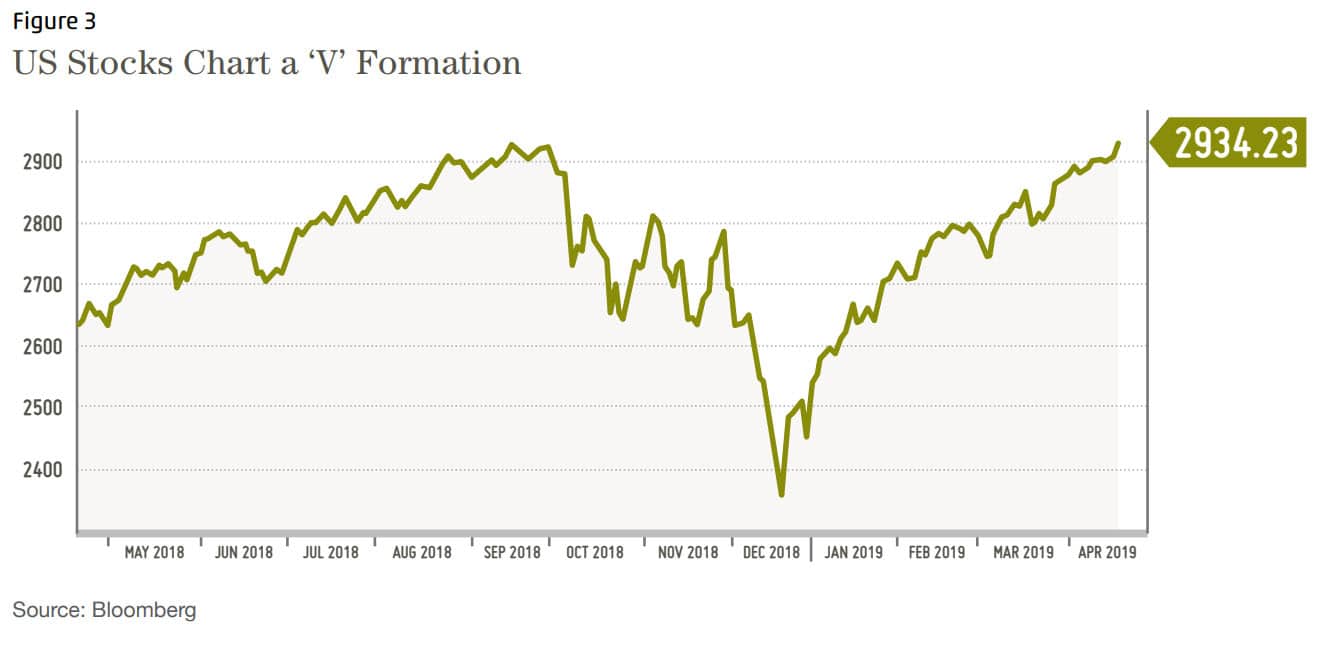
US stocks gained through September 2018, while Chinese stocks fell. Chinese stocks were faltering on trade war fears and a general slowdown in their economy. After September, a global recession became the meme du jour for investors, causing US stocks to rollover and erasing all its 2018 gains and then some.
As the global economic outlook grew uglier into December and January, two things happened to turn faltering
stock markets into big rallies:
The Chinese government encouraged more borrowing (lending); and
The Fed decided in late January to put future interest rate increases on hold.
As the Chinese economy slowed through 2018 and Chinese stocks crumbled, questions arose about China’s
high debt levels, its willingness to continue using debt (lending) to stimulate the economy, and whether its officials
had been lying about its economic growth. (This was a topic in my 2018 fourth quarter newsletter.)
The Chinese government answered the market’s concerns by assuring entrepreneurs that it supported them and by encouraging more lending. Coupled with improved trade talk sentiment, a strong Chinese stock market rebound ensued.
You might ask, “But aren’t markets concerned about the growing Chinese debt?” The answer is yes, they are, and so am I, but the stock market was more concerned about a faltering Chinese economy. The ongoing use of debt to maintain unprofitable sectors of the economy is like feeding an addiction – while an addiction is unlikely to end well, it can go on a long time before the user crashes and his life unravels very quickly
How interest rates played a role in the US stock market fall and recovery
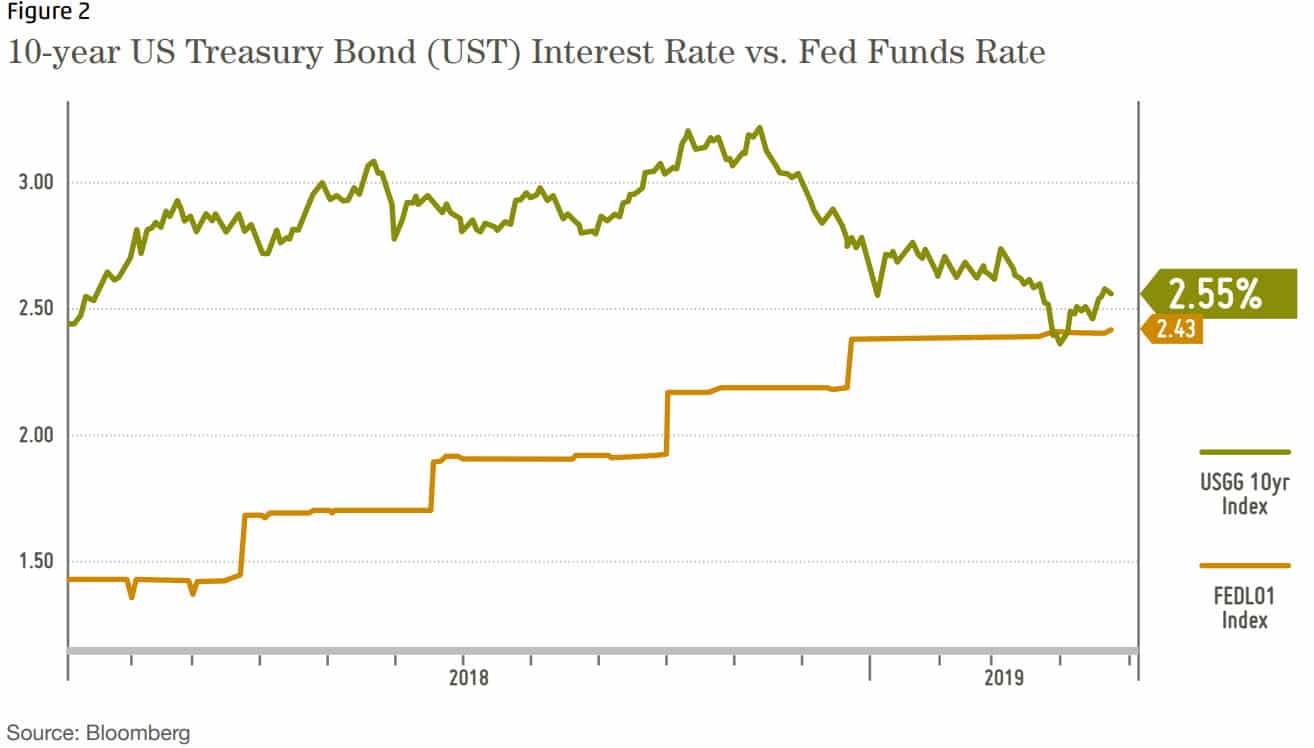
Figure 2 plots the Fed Funds Rate (FFR in white) on the bottom and the 10-year US Treasury Bond rate. The FFR (the bottom line in Figure 2, below) is set by the Federal Reserve Bank. It is the interest rate on overnight borrowing that banks charge other banks. This rate determines other short-term rates. The FFR is the interest rate that investors talk about when discussing the Fed. It has a stair step pattern because it is set by a Board rather than being determined by the market.
The top line in Figure 2 below tracks the interest rate on the 10-year US Treasury bond. This rate is determined by the market and is a reflection many different variables, including the economic outlook and inflation expectations.
As you can see in Figure 2, the 10-year UST yield peaked in mid-November. The yield began declining in midNovember on fears that the Fed would continue raising the Fed funds rate and thus increase the odds of a recession. As the 10-year UST and Fed funds rate converged, investors became concerned about a yield curve inversion; a situation in which short term rates are higher than long term rates. This has historically been a strong signal that a recession is on the horizon. Stock prices fell in response (see Figure 3 on the following page).
Looking ahead, bond investors know that, in a recession, long term rates fall and bond prices go up (when yields go up, bond prices go down). In my view, recession concerns about an approaching yield curve inversion / recession signal had a self-fulfilling aspect as investors bought bonds in anticipation of inversion. Or, to put it more generically, the thing they were doing (buying 10-year US Treasuries in fear of recession) created the thing they feared (an inverted yield curve that indicates a recession).
The Fed’s rate increases are designed to:
Normalize rates after a period of extraordinarily low rates (during the Great Recession the Fed funds rate dropped to zero to stimulate economic activity) and
Moderate economic activity to keep inflation in check (at around 2%) while simultaneously allowing the economy
to keep growing.
This raises a question: “How does the Fed know when its encouraging too much lending that then leads to a bubble which then busts, crashes the economy, tanks asset prices and wrecks investor’s financial security?” The answer, unfortunately, is that the Fed doesn’t really know when it’s gone too far until after the fact. In the Fed’s defense, some of the ‘going too far’ is what investors repeatedly do and is beyond the control of the Fed. For an excellent overview of the limitations of the Fed’s ability to address financial bubbles, please see this essay: https://www.minneapolisfed.org/news-and-events/messages/monetary-policy-and-bubbles
In the essay, Neel Kashkari, the president of the Federal Reserve Bank of Minneapolis, writes, “The Fed’s job is not to
protect investors. It is to promote financial stability. Sometimes those overlap. Not always.” (Note: please call or email
if you would like me to send you a hard copy.)
To summarize, investors would do well to not hang their hopes on the Fed continuing to rescue the stock market as it did this past quarter.
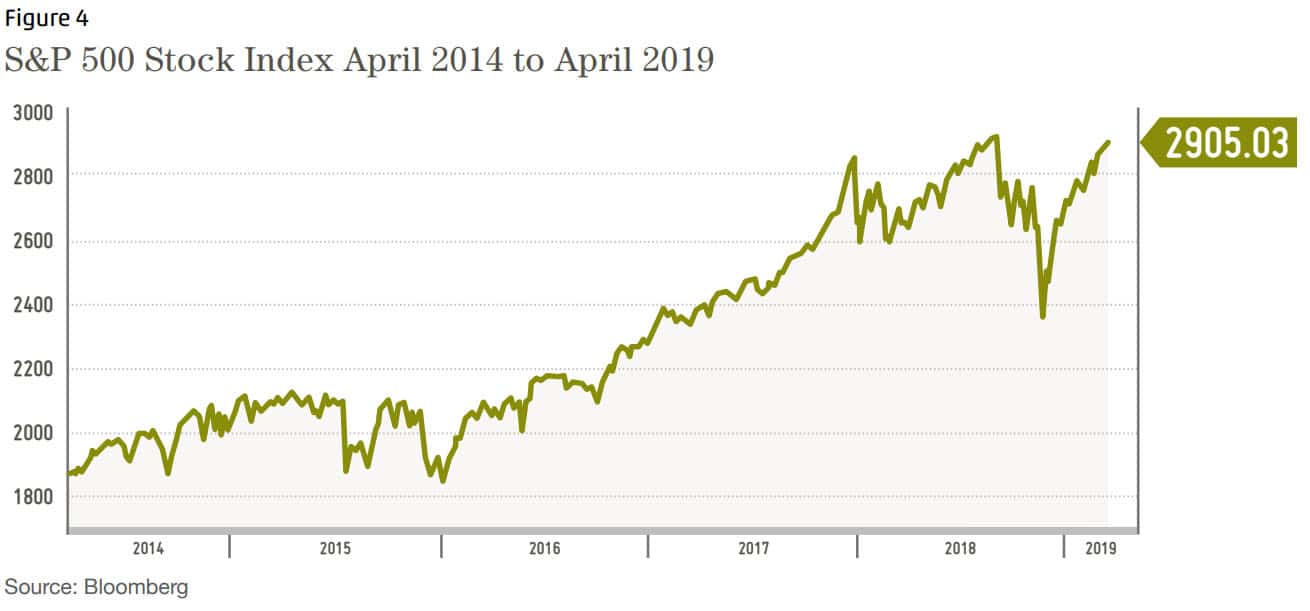
Finally, below is a chart showing the past 5 years stock market performance. Volatility has increased significantly over the past 18 months. It seems we are in the late innings of this market cycle.
Revisiting Current Stock Market Valuation Measures
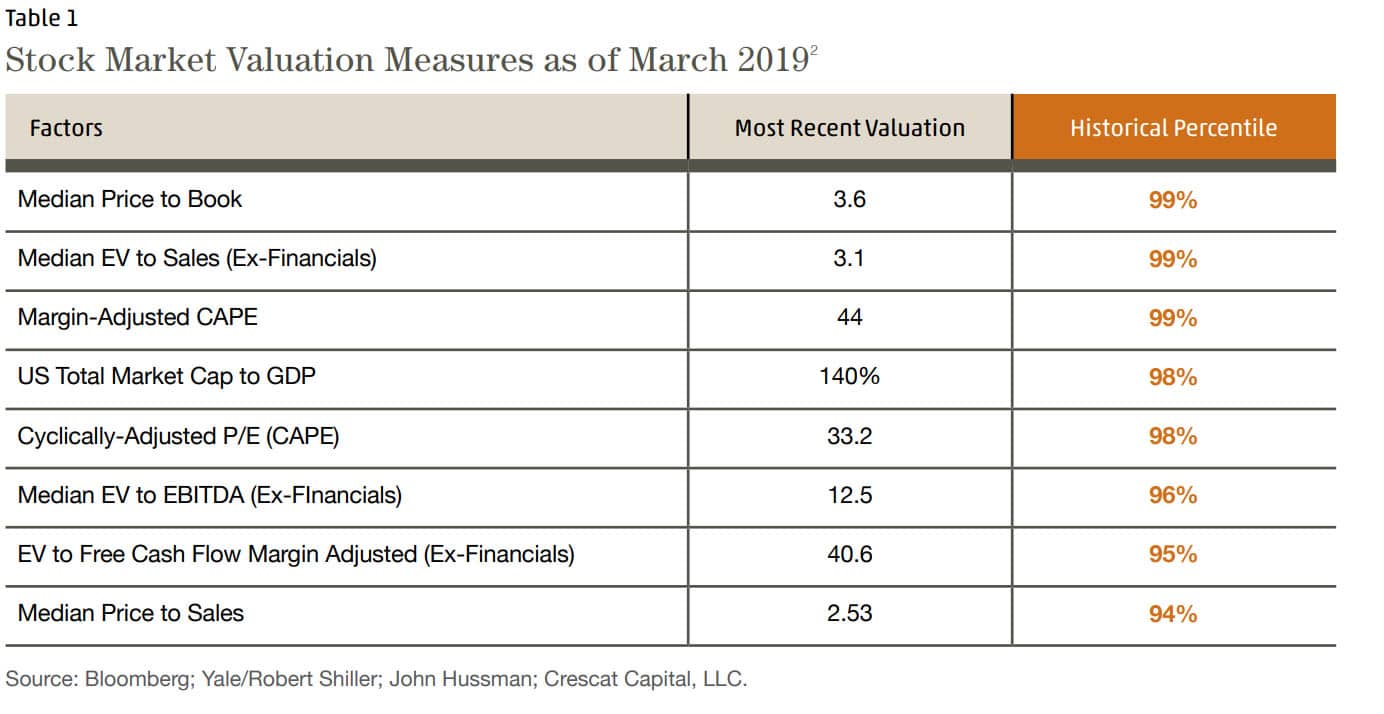
In previous newsletters, I have mentioned high valuations as a reason for caution. As a reminder, high valuations are like extremely dry tinder in a forest: while it doesn’t cause the fire, it is the fuel that creates the conflagration after the initial spark. I don’t know what will cause the spark nor when it might occur. These conditions have persisted for a few years. Table 1 on the following page illustrates just how highly valued the market is from a historical perspective. The right column (orange text) reveals that stock values as measured by these factors are greater than 94% to 99% of all prior periods. Now that’s buying high!
Looking Ahead
Current conditions and volatility suggest more prudence than usual. I conclude with a recent Warren Buffet quote that aligns with our mission statement: “Transform Money from a Source of Worry to a Resource for FulfilmentTM”.
“But Charlie and I sleep well. Both of us believe it is insane to risk what you have and need in order to obtain what you don’t need.”
—Feb 24, 2018, Warren Buffett’s annual letter to shareholders
As always, if you feel this is an overly cautious approach for your situation and wish to take more risk for potentially better rewards, please contact me. It is not difficult to change your investments to give you more upside exposure.
1MCS Family Wealth Advisors (MCS) consolidated client returns are dollar-weighted, net of investment management fees unless stated otherwise, include reinvestment of dividends and capital gains and represent all clients with fully discretionary accounts under management for at least one full month during the period. Individual client returns represent client discretionary accounts under management for the entire period – starting on 12/31/2017 and ending on 09/30/2018.These accounts represent 97% of MCS’s discretionary fee-paying assets under management as of 09/30/2018 and were invested primarily in US stocks and bonds (15% of client assets on 09/30/2018 were invested in tax-exempt municipal bonds). The Stock Index values are based on the S&P 500 Total Return Index, which measures the large capitalization US equity market. The Bond Index values are based on the Barclays Capital US Aggregate Bond Index, which measures the US investment-grade bond market. Index values are for comparison purposes only. The report is for information purposes only and does not consider the specific investment objective, financial situation, or particular needs of any recipient, nor is it to be construed as an offer to sell or solicit investment management or any other services. Past performance is not indicative of future results. 2A description of all these valuation ratios may be found at www.investopedia.com.
Notes about this table:
Median – If you took all of the S&P 500 values for each ratio and lined them up from smallest to largest, the median value
would be the one in the middle.
Price to Book – The Price to Book ratio measures the total market value of a company against the company’s net assets.
EV (Enterprise Value) – A comprehensive measure of a company’s market value that includes outstanding stock, bonds
and cash on the balance sheet.
Cyclically Adjusted Price Earnings Ratio (CAPE) is also called the Shiller Ratio and uses a 10-year price earnings ratio to
smooth out a business cycle’s fluctuations in valuations.
US Total Market Capitalization to GDP is known as the “Buffett Valuation Indicator” after Warren Buffett remarked on its
usefulness as a market valuation tool in 2001.
Categories
2019 First Quarter Newsletter & Outlook
Investors are on edge. One good quarter does not a year’s performance make. I interpret the recent market volatility as evidence that we are in the late stage of the economic recovery and bull market. This quarter’s newsletter will follow up briefly on my China comments in the last newsletter, review the market volatility of the past 15 months, and end with a sobering overview of current market valuations.
In the first quarter of 2019 (if MCS clients’ investments were treated as one large portfolio including their cash), on average clients gained 2.09%1, after fees. For comparison purposes, the S&P 500 Total Return Stock Index (S&P 500) gained 13.65%, and the Barclays Aggregate Bond Index gained 2.94%. The range of MCS individual client returns was from a gain of 0.21 % to a gain of 5.43%.
The first quarter of 2019 (when stocks soared) was the mirror image of the fourth quarter of 2018 (when stocks tanked). In fact, over the six-month period of September 30, 2018 to March 31, 2019, the S&P 500 lost 1.72%. The Barclays Aggregate Bond Index gained 2.94% in this period, and MCS clients, on average, gained 0.89%.
MCS clients with the highest returns held concentrated stock positions that outperformed, or they had a comparatively higher equity allocation than other clients. The client with the lowest return had an account that was not yet fully invested, and others who underperformed were similarly concentrated in lower-risk short-term bonds and cash.
Six Months of Market Volitility
The US economy and Federal Reserve Bank’s interest rate policy co-starred with events in China to lead the markets’ recent drama. What follows is a simplified version of the past 15 months to help review where we’ve been and understand where we are now.
Throughout 2018, the global economy had been slowing while the US economy continued its growth. In the US, short-term interest rates were rising in response to US growth and to a tightening labor market, while abroad growth was faltering, and interest rates in China and Germany tracked lower. Long term US rates also rose in response to US economic growth and potential inflation threats from a tight labor market.
A proxy for global growth (not including the US economy) is China, the world’s biggest or second biggest economy (depending on how its measured).
US stocks gained through September 2018, while Chinese stocks fell. Chinese stocks were faltering on trade war fears and a general slowdown in their economy. After September, a global recession became the meme du jour for investors, causing US stocks to rollover and erasing all its 2018 gains and then some.
As the global economic outlook grew uglier into December and January, two things happened to turn faltering
stock markets into big rallies:
As the Chinese economy slowed through 2018 and Chinese stocks crumbled, questions arose about China’s
high debt levels, its willingness to continue using debt (lending) to stimulate the economy, and whether its officials
had been lying about its economic growth. (This was a topic in my 2018 fourth quarter newsletter.)
The Chinese government answered the market’s concerns by assuring entrepreneurs that it supported them and by encouraging more lending. Coupled with improved trade talk sentiment, a strong Chinese stock market rebound ensued.
You might ask, “But aren’t markets concerned about the growing Chinese debt?” The answer is yes, they are, and so am I, but the stock market was more concerned about a faltering Chinese economy. The ongoing use of debt to maintain unprofitable sectors of the economy is like feeding an addiction – while an addiction is unlikely to end well, it can go on a long time before the user crashes and his life unravels very quickly
How interest rates played a role in the US stock market fall and recovery
Figure 2 plots the Fed Funds Rate (FFR in white) on the bottom and the 10-year US Treasury Bond rate. The FFR (the bottom line in Figure 2, below) is set by the Federal Reserve Bank. It is the interest rate on overnight borrowing that banks charge other banks. This rate determines other short-term rates. The FFR is the interest rate that investors talk about when discussing the Fed. It has a stair step pattern because it is set by a Board rather than being determined by the market.
The top line in Figure 2 below tracks the interest rate on the 10-year US Treasury bond. This rate is determined by the market and is a reflection many different variables, including the economic outlook and inflation expectations.
As you can see in Figure 2, the 10-year UST yield peaked in mid-November. The yield began declining in midNovember on fears that the Fed would continue raising the Fed funds rate and thus increase the odds of a recession. As the 10-year UST and Fed funds rate converged, investors became concerned about a yield curve inversion; a situation in which short term rates are higher than long term rates. This has historically been a strong signal that a recession is on the horizon. Stock prices fell in response (see Figure 3 on the following page).
Looking ahead, bond investors know that, in a recession, long term rates fall and bond prices go up (when yields go up, bond prices go down). In my view, recession concerns about an approaching yield curve inversion / recession signal had a self-fulfilling aspect as investors bought bonds in anticipation of inversion. Or, to put it more generically, the thing they were doing (buying 10-year US Treasuries in fear of recession) created the thing they feared (an inverted yield curve that indicates a recession).
The Fed’s rate increases are designed to:
to keep growing.
This raises a question: “How does the Fed know when its encouraging too much lending that then leads to a bubble which then busts, crashes the economy, tanks asset prices and wrecks investor’s financial security?” The answer, unfortunately, is that the Fed doesn’t really know when it’s gone too far until after the fact. In the Fed’s defense, some of the ‘going too far’ is what investors repeatedly do and is beyond the control of the Fed. For an excellent overview of the limitations of the Fed’s ability to address financial bubbles, please see this essay:
https://www.minneapolisfed.org/news-and-events/messages/monetary-policy-and-bubbles
In the essay, Neel Kashkari, the president of the Federal Reserve Bank of Minneapolis, writes, “The Fed’s job is not to
protect investors. It is to promote financial stability. Sometimes those overlap. Not always.” (Note: please call or email
if you would like me to send you a hard copy.)
To summarize, investors would do well to not hang their hopes on the Fed continuing to rescue the stock market as it did this past quarter.
Finally, below is a chart showing the past 5 years stock market performance. Volatility has increased significantly over the past 18 months. It seems we are in the late innings of this market cycle.
Revisiting Current Stock Market Valuation Measures
In previous newsletters, I have mentioned high valuations as a reason for caution. As a reminder, high valuations are like extremely dry tinder in a forest: while it doesn’t cause the fire, it is the fuel that creates the conflagration after the initial spark. I don’t know what will cause the spark nor when it might occur. These conditions have persisted for a few years. Table 1 on the following page illustrates just how highly valued the market is from a historical perspective. The right column (orange text) reveals that stock values as measured by these factors are greater than 94% to 99% of all prior periods. Now that’s buying high!
Looking Ahead
Current conditions and volatility suggest more prudence than usual. I conclude with a recent Warren Buffet quote that aligns with our mission statement: “Transform Money from a Source of Worry to a Resource for FulfilmentTM”.
—Feb 24, 2018, Warren Buffett’s annual letter to shareholders
As always, if you feel this is an overly cautious approach for your situation and wish to take more risk for potentially better rewards, please contact me. It is not difficult to change your investments to give you more upside exposure.
1MCS Family Wealth Advisors (MCS) consolidated client returns are dollar-weighted, net of investment management fees unless stated otherwise, include reinvestment of dividends and capital gains and represent all clients with fully discretionary accounts under management for at least one full month during the period. Individual client returns represent client discretionary accounts under management for the entire period – starting on 12/31/2017 and ending on 09/30/2018.These accounts represent 97% of MCS’s discretionary fee-paying assets under management as of 09/30/2018 and were invested primarily in US stocks and bonds (15% of client assets on 09/30/2018 were invested in tax-exempt municipal bonds). The Stock Index values are based on the S&P 500 Total Return Index, which measures the large capitalization US equity market. The Bond Index values are based on the Barclays Capital US Aggregate Bond Index, which measures the US investment-grade bond market. Index values are for comparison purposes only. The report is for information purposes only and does not consider the specific investment objective, financial situation, or particular needs of any recipient, nor is it to be construed as an offer to sell or solicit investment management or any other services. Past performance is not indicative of future results.
2A description of all these valuation ratios may be found at www.investopedia.com.
Notes about this table:
would be the one in the middle.
and cash on the balance sheet.
smooth out a business cycle’s fluctuations in valuations.
usefulness as a market valuation tool in 2001.