Individual client returns ranged from 2.9% to 12.2% for the year. These asset value increases compare with 16% for the S&P 500 (stock index) and 4.2% for the Barclays Capital Aggregate Bond Index (taxable bonds).
For the first quarter of 2013, aggregate MCS assets gained 2.8%.* Stocks represented by the S&P 500 index during the first quarter turned in a very strong performance of 10.6%, reminiscent of 2012’s first quarter gain of 12.6%. Sub-advised stock portfolios gained 7.7% for the quarter. The bond market represented by the Barclays index lost 0.1%.
In December I thought odds were even as to whether the failure to address sequestration (automatic spending cuts) with an alternative would cause more volatility in risk assets. Well, it was “tails,” and [yawn] the stock market has shrugged off the implications of lower growth stemming from automatic spending cuts. To the extent that the economy continues its ploddingly slow growth despite sequestration, it is bullish for stocks. Economic growth and slowing deficit growth paint a better economic picture.
Economic Outlook
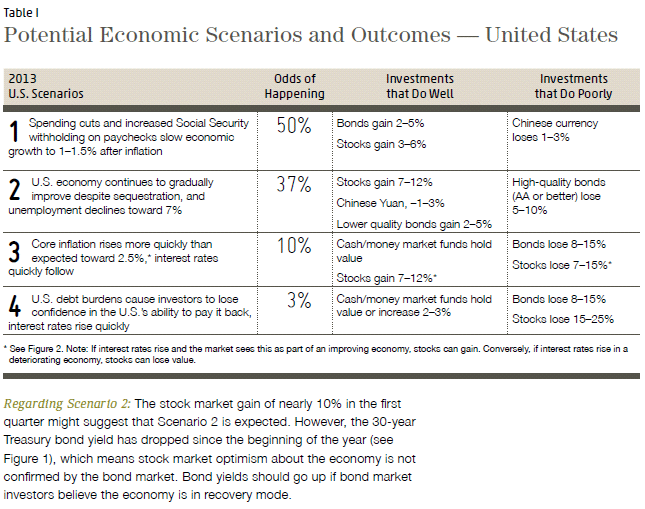
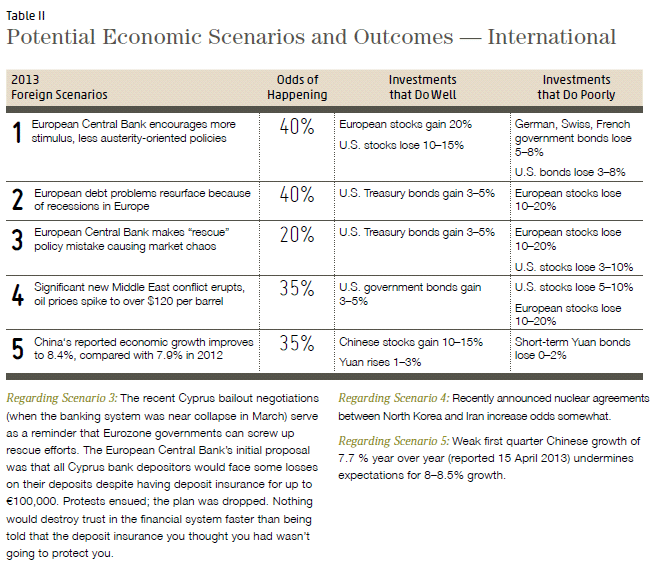
Tables I and II outline potential 2013 scenarios, my estimate of the chances of each scenario occurring, and how the scenario occurring would affect various investments. As you can see by looking at the “odds it will happen” column, I don’t have a lot of confidence in any one scenario. Which investments “do well or poorly” depend on what plays out in 2013. Generally, financial crisis and lackluster economic reports are good for bonds, whereas improving economic conditions are good for stocks. Of course, I could be wrong about the scenarios, or the investment performance, or both, or we could see scenarios I did not consider.
Investment Strategy
We will gradually increase exposure to stocks
At the end of the first quarter 2012 we began gradually increasing stock market exposure. I anticipate continuing to increase stock exposure in 2013. At this point, new stock market highs are not similar to previous highs in 2000 or 2007–2008. Today’s highs are not being generated by ridiculous valuations of tech companies (2000) or an overheated real estate/credit-driven economic expansion (2007–2008).
Nevertheless, Bank Credit Analyst, an independent economic research service, is forecasting an economic slowdown over the next two quarters indicating that stock prices have run up too quickly and a correction is likely. Sequestration, an automatic reduction in U.S. government spending, will gradually slow economic growth. On March 30, for example, The Register-Guard, the local Eugene newspaper, described the shock of 41 states plus county governments over the U.S. Forest Service’s demand that these governments return money already sent to them and over projected cuts to the Department of the Interior due to sequestration. Thus, over the next couple quarters I am cautious but see continued gradual stock buying. We will reduce and/or alter bond exposure
This past quarter, I’ve enjoyed some interesting discussions with University of Oregon economist and Federal Reserve Bank expert Tim Duy and reviewed the latest Bank Credit Analyst economic research. What follows is a synopsis of the picture that emerged from my research.
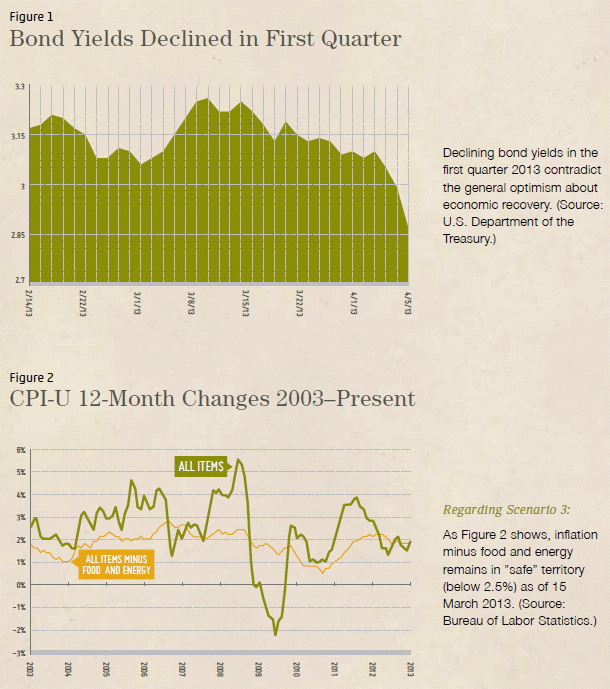
Background: Fed policies have kept bond yields low. The Fed has kept short rates low by setting the Fed Funds rate (interest rate on loans between banks) at zero. They have kept longer term rates lower than “normal” through the purchase of U.S. Treasury and mortgage bonds at a rate of $85 billion per month. It is estimated that this strategy has lowered long-term rates by 0.8–1.2%. When the Fed bond buying program ends, interest rates are expected to rise. Bond prices move opposite to the direction of interest rates.
My question: Assuming we are now on a slow but sustainable growth path, how disruptive will the ending of extraordinary Federal Reserve polices be to the markets, especially bonds?
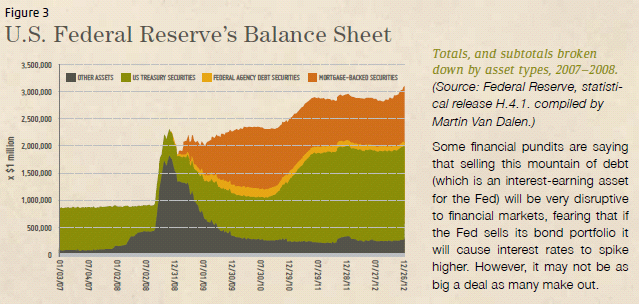
Because much of the Fed’s strategy is new, markets are uncertain about what will happen when the Fed changes its strategy from increasing economic growth to slowing growth to manage inflation. The Fed’s role in bond markets holds especially significant potential because it now owns about $3 trillion dollars’ worth of bonds (see Figure 3).
First, the Fed does not have to sell these bonds. It could just let the bonds mature. Mortgage-backed bonds pay interest and principal back each month. Even if the Fed incurs a loss on the sale of bonds, according to Bank Credit Analyst the loss is accounted for as a “deferred asset” (yes, only the government would call a loss an asset), and when the Fed has interest earnings it will use those earnings to offset the loss — er, um . . . asset.
While pundits wring their hands over the possibility of higher inflation, it appears that the Fed has many ways to raise both short- and long-term interest rates to fight inflation should it become a problem. The implications are that a dire inflationary end to all this debt accumulation may be incorrect.
Bottom Line
In the past, bonds have shown an exceptional ability to anchor portfolio value through economic crises. The current environment of high debt, historically low interest rates, and unprecedented economic policies presents an extremely challenging investment environment. A rise in interest rates will cause bond prices to decline, but stocks could gain or lose depending on the scenario. Prudently shifting a portion of your portfolio to stocks of strong, income-producing companies is a reasonable path forward given the uncertainties.
Click here to read Michael’s thoughts on the relationship between interest rates and bond prices. *MCS portfolio returns are dollar-weighted, net of investment management fees, include reinvestment of dividends and capital gains, and represent all fully discretionary income/growth accounts. These accounts represent 90% of MCS Family Wealth Advisors’ assets under management as of 03/31/2013 and were invested primarily in U.S. stocks and bonds. There is no guarantee that prior performance will continue in the future, or that any statement of opinion herein has value beyond the date of this publication. Bond performance does not include the effect of state or federal taxes. The S&P 500 Total Return Index measures the large-capitalization U.S. equity market, and the Barclays Capital U.S. Aggregate Bond Index measures the U.S. investment-grade bond market. Index values include reinvestment of dividends and income and are for comparison purposes only.
Categories
2012-2013 Performance Report and Investment Outlook
Individual client returns ranged from 2.9% to 12.2% for the year. These asset value increases compare with 16% for the S&P 500 (stock index) and 4.2% for the Barclays Capital Aggregate Bond Index (taxable bonds).
For the first quarter of 2013, aggregate MCS assets gained 2.8%.* Stocks represented by the S&P 500 index during the first quarter turned in a very strong performance of 10.6%, reminiscent of 2012’s first quarter gain of 12.6%. Sub-advised stock portfolios gained 7.7% for the quarter. The bond market represented by the Barclays index lost 0.1%.
In December I thought odds were even as to whether the failure to address sequestration (automatic spending cuts) with an alternative would cause more volatility in risk assets. Well, it was “tails,” and [yawn] the stock market has shrugged off the implications of lower growth stemming from automatic spending cuts. To the extent that the economy continues its ploddingly slow growth despite sequestration, it is bullish for stocks. Economic growth and slowing deficit growth paint a better economic picture.
Economic Outlook
Tables I and II outline potential 2013 scenarios, my estimate of the chances of each scenario occurring, and how the scenario occurring would affect various investments. As you can see by looking at the “odds it will happen” column, I don’t have a lot of confidence in any one scenario. Which investments “do well or poorly” depend on what plays out in 2013. Generally, financial crisis and lackluster economic reports are good for bonds, whereas improving economic conditions are good for stocks. Of course, I could be wrong about the scenarios, or the investment performance, or both, or we could see scenarios I did not consider.
Investment Strategy
We will gradually increase exposure to stocks
At the end of the first quarter 2012 we began gradually increasing stock market exposure. I anticipate continuing to increase stock exposure in 2013. At this point, new stock market highs are not similar to previous highs in 2000 or 2007–2008. Today’s highs are not being generated by ridiculous valuations of tech companies (2000) or an overheated real estate/credit-driven economic expansion (2007–2008).
Nevertheless, Bank Credit Analyst, an independent economic research service, is forecasting an economic slowdown over the next two quarters indicating that stock prices have run up too quickly and a correction is likely. Sequestration, an automatic reduction in U.S. government spending, will gradually slow economic growth. On March 30, for example, The Register-Guard, the local Eugene newspaper, described the shock of 41 states plus county governments over the U.S. Forest Service’s demand that these governments return money already sent to them and over projected cuts to the Department of the Interior due to sequestration. Thus, over the next couple quarters I am cautious but see continued gradual stock buying.
We will reduce and/or alter bond exposure
This past quarter, I’ve enjoyed some interesting discussions with University of Oregon economist and Federal Reserve Bank expert Tim Duy and reviewed the latest Bank Credit Analyst economic research. What follows is a synopsis of the picture that emerged from my research.
Background: Fed policies have kept bond yields low. The Fed has kept short rates low by setting the Fed Funds rate (interest rate on loans between banks) at zero. They have kept longer term rates lower than “normal” through the purchase of U.S. Treasury and mortgage bonds at a rate of $85 billion per month. It is estimated that this strategy has lowered long-term rates by 0.8–1.2%. When the Fed bond buying program ends, interest rates are expected to rise. Bond prices move opposite to the direction of interest rates.
My question: Assuming we are now on a slow but sustainable growth path, how disruptive will the ending of extraordinary Federal Reserve polices be to the markets, especially bonds?
Because much of the Fed’s strategy is new, markets are uncertain about what will happen when the Fed changes its strategy from increasing economic growth to slowing growth to manage inflation. The Fed’s role in bond markets holds especially significant potential because it now owns about $3 trillion dollars’ worth of bonds (see Figure 3).
First, the Fed does not have to sell these bonds. It could just let the bonds mature. Mortgage-backed bonds pay interest and principal back each month. Even if the Fed incurs a loss on the sale of bonds, according to Bank Credit Analyst the loss is accounted for as a “deferred asset” (yes, only the government would call a loss an asset), and when the Fed has interest earnings it will use those earnings to offset the loss — er, um . . . asset.
While pundits wring their hands over the possibility of higher inflation, it appears that the Fed has many ways to raise both short- and long-term interest rates to fight inflation should it become a problem. The implications are that a dire inflationary end to all this debt accumulation may be incorrect.
Bottom Line
In the past, bonds have shown an exceptional ability to anchor portfolio value through economic crises. The current environment of high debt, historically low interest rates, and unprecedented economic policies presents an extremely challenging investment environment. A rise in interest rates will cause bond prices to decline, but stocks could gain or lose depending on the scenario. Prudently shifting a portion of your portfolio to stocks of strong, income-producing companies is a reasonable path forward given the uncertainties.
Click here to read Michael’s thoughts on the relationship between interest rates and bond prices.
*MCS portfolio returns are dollar-weighted, net of investment management fees, include reinvestment of dividends and capital gains, and represent all fully discretionary income/growth accounts. These accounts represent 90% of MCS Family Wealth Advisors’ assets under management as of 03/31/2013 and were invested primarily in U.S. stocks and bonds. There is no guarantee that prior performance will continue in the future, or that any statement of opinion herein has value beyond the date of this publication. Bond performance does not include the effect of state or federal taxes. The S&P 500 Total Return Index measures the large-capitalization U.S. equity market, and the Barclays Capital U.S. Aggregate Bond Index measures the U.S. investment-grade bond market. Index values include reinvestment of dividends and income and are for comparison purposes only.